MFI Indicator
Contents
MFI indicator description
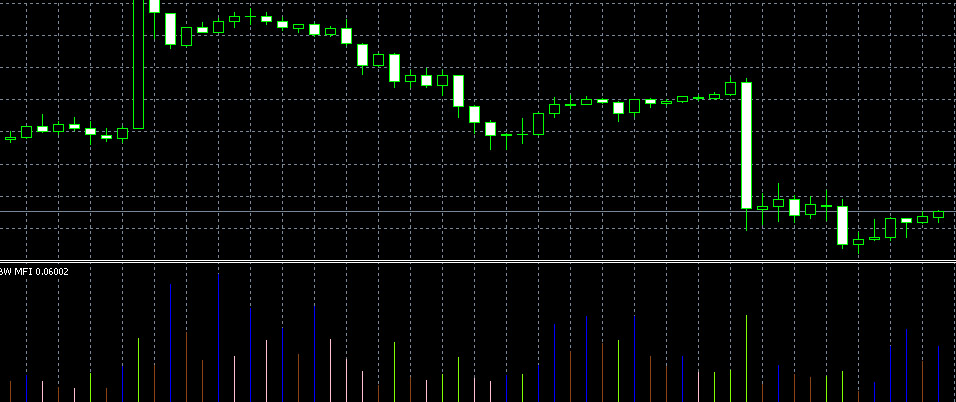
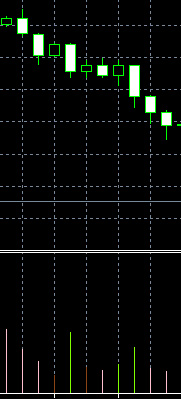
MFI indicator (Fig. 1) – Market Facilitation Index (Market Facilitation Index) is designed to assess the amplitude of the price over a certain period, depending on the volume of forex trading in a certain amount of time.
The formula for its calculation is as follows: MFI = (High – Low)/Volume, where High – the maximum price for a certain period, and Low – the minimum price for a certain period, Volume – trading volume.
Image. 1
Indicator for forex The MFI was developed by Bill Williams, a famous millionaire trader and proponent of technical analysis in trading the financial markets, the founder of the famous trader’s school “Profitunity Trading Group”. He is the author of several other indicators, such as Alligator, AO, AC, which he described in his book “Trading Chaos.
The MFI was originally used for stock trading on the stock market. But later it turned out that it can also be effectively used in the forex market (The whole truth about forex).
The principle of operation of the Market Facilitation Index is based on the comparison of the dynamics of trading volumes and prices during a certain period. On the basis of these changes it is possible to confirm or refute a trend. Measurements are made relative to the previous index value. It means that if MFI is more than the previous index, the prices will grow. The index is connected with the volatility, which is typical for the asset at the moment of measuring. Market Facilitation Index does not give signals for entry or exit, it is used as an additional indicator when trading. However, it can be used on any timeframe.
At graphic The MFI is represented as a histogram of bars, which, depending on the market situation, are colored in green, brown, blue, pink. These are standard colors, the trader can choose other colors in the trading terminal. The MFI is estimated as generating quite a lot of false signals, but in general it gives quite accurate information.
Despite the fact that MFI is quite actively used in forex trading as a trader’s tool and quite a simple and understandable indicator, but it is rather a market analysis tool, whose main purpose is to give the trader a deeper understanding of the market, to show clearly what sentiment prevails in the market at a particular point in time (Forex Trading Training).
Log in to your broker’s terminal, add the MFI indicator to the chart and see what comes out
| Broker | Bonuses | Open an account |
|---|---|---|
|
1
|
50 %
Bonus on deposit from $100 USD – promo code WELCOME50
|
Start |
|
2
|
From 25 To 60 %
Deposit increase for the first deposit
|
Start |
|
3
|
Cashback
Refunds of commissions, spreads and other costs
|
Start |
|
4
|
100 USD
Loyalty program remuneration
|
Start |
|
5
|
20 %
Bonus and cashback by promo code revieweek23
|
Start |
MFI indicator in the MetaTrader 5 platform
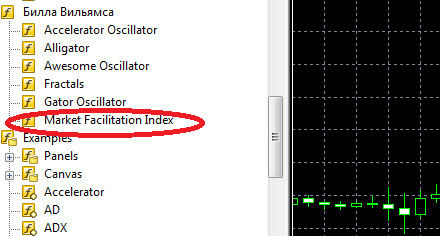
The MFI indicator is presented on popular trading platforms in the list of standard instruments. On the MetaTrader 5 platform it is in the list of Bill Williams’ indicators (Figure 2).
Image. 2
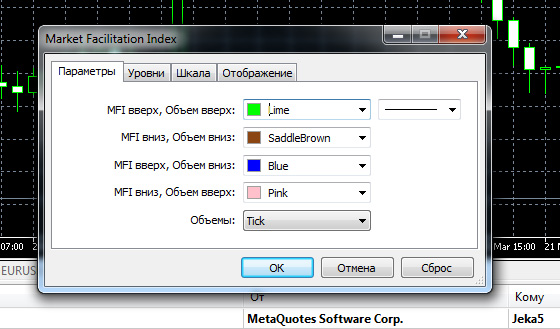
After clicking on the file with the indicator on the chart, the settings window appears, which, interestingly enough, explains the color values of the indicator (Fig. 3).
Image. 3
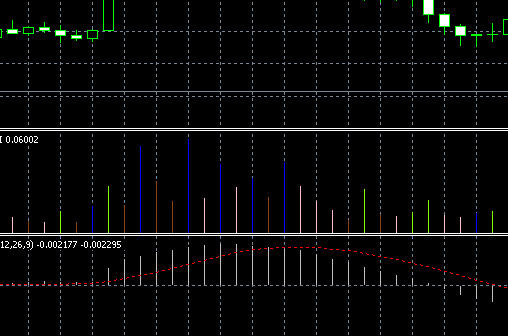
There is no point in changing the standard settings of the indicator, so by pressing the “OK” button, the trader loads the indicator onto the chart (Fig. 4). When hovering the cursor over the indicator bar, you can see the index indicators.
Image. 4
The indicator is located at the bottom of the chart, for example, in Fig. 4 you can clearly see the activity of the blue bar of the MFI indicator. If you direct your cursor to it, you can see how the index shows growth, while trading volume is reduced. This information shows that trades should not be opened, it is necessary to wait for further movement of volumes and indicator changes.
You can also understand that by itself this indicator can not give information about when to enter the market, you need some other Oscillators for ForexThe MACD (Fig. 5), for example, which is placed below the MFI.
Image. 5
MFI indicator signals
The green color shows the growing index and trading volume, confirming that the market is reviving in the direction of a certain trend – the number of transactions increases and, if the trader entered the market, the index confirms the correctness of his actions. Green color on a downtrend shows that the decline can be significant, and vice versa, on an uptrend green shows that the price growth will be significant. Often green corresponds to an impulse change in price.
The brown color marks the decline in the indicator indicators, respectively, a decrease in volumes. Traders close positions and exit trading. This bar is also called “fading”. It can be formed when the price reaches a maximum or minimum, when market participants are not interested in either buying or selling, volatility drops, but at the same time the situation can change and one should be ready to open a position at the very beginning of the trend formation. Several brown lines indicate that the trend is about to change.
It is a deceptive signal, it is also called a “false” signal, the one which is not recommended to be used as a reference point when estimating the market situation and opening deals by it. It shows the contradiction between the growth of activity despite the decrease in volumes, which, in Williams’ opinion, can indicate a manipulation of the market. Williams, may indicate the manipulative nature of the price movement.
Pink represents the end of a trend – volumes are up, but the MFI is down, reflecting a confrontation between buyers and sellers. It is also called “crouching” as if before a jump – this color indicates that big players are probably accumulating positions. Also, this bar ends an impulse movement. How this bar ends shows a breakout into a continuation or trend reversal.
Based on the information of the squat bar, the trader can accurately assess the situation and enter the market at the best time. But for this purpose it is necessary to use other indicators, the MFI is not informative enough. Bill Williams himself in his book “Trading Chaos” suggested to use the MFI with indicators MACD, by fractals and Fibonacci levels. The indicator is actively used in strategies using Elliott waves.
Trading strategies based on MFI
One of the strategies using the MFI is to focus on the pink bar. You can see on the chart that the pink bars of the MFI indicator generally correspond to the trend reversal start points (Fig. 6).
The trader, guided by the indicator indicators, assesses the further movement of the trend, placing both buy and sell orders simultaneously, close to the extremums of the pink bar of the indicator. When the order triggers, the other order is canceled, if the indicator forms a green bar, it confirms the correctness of the trader’s actions.
That is, in this case, the indicator allows the trader to enter the trade before the trend is formed, the MFI triggered as a leading indicator. It is possible to trade with the MFI alone, but it is an unreliable strategy. Additional tools would be appropriate here to more accurately determine the point of entry into the trade.
Image. 6
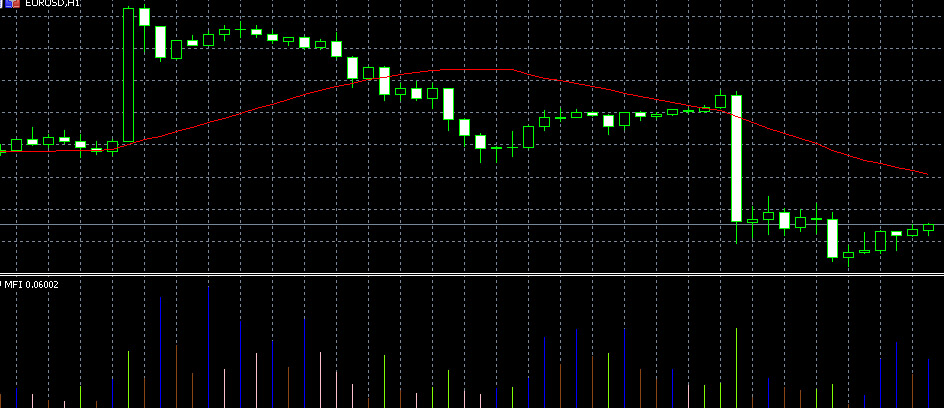
For example, such a tool could be a moving average MA. The strategy implies that the MFI confirms the signals of the moving average. To implement the strategy, you need to load the MA on the chart, set the required period in the indicator settings window (Fig. 7).
The trader marks when the price crosses the MA from top to bottom, it is assumed that the trend is changing, which is confirmed by the pink bar. And a sell order is set below the local minimum. If the opposite situation occurs, the price crosses the MA from below upwards, orders are set above the local maximum. Stop losses are used in this strategy.
Image. 8
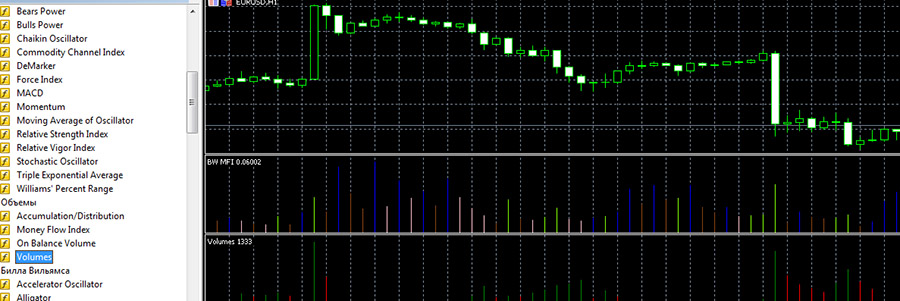
The MFI can be used, for example, with the Volumes indicator (fig. 8).
_
A sufficiently long time frame is chosen for trading. It is believed that the combined use of these indicators provides very accurate leading information about the market situation. If a strong uptrend is seen on the chart, a green bar is formed on the MFI and a green bar is also formed on the Volumes indicator, a trader can open a buy trade. In this case the green MFI bar can even serve as a signal, although in other cases it only confirms the correctness of trader’s conclusions regarding the trend direction.
Bill Williams suggested using a strategy that uses Elliott waves and MACD. In this strategy, if the pink MFI bar is in the predicted target zone of the Elliott wave and at the same time the MACD shows a divergence, it almost certainly means a trend reversal. That is why Bill Williams believed that in such a situation, it is possible to place a buy order slightly above the maximum and a sell order slightly below the minimum and wait to see where the trend reverses. This strategy is recommended on timeframes from 4H.
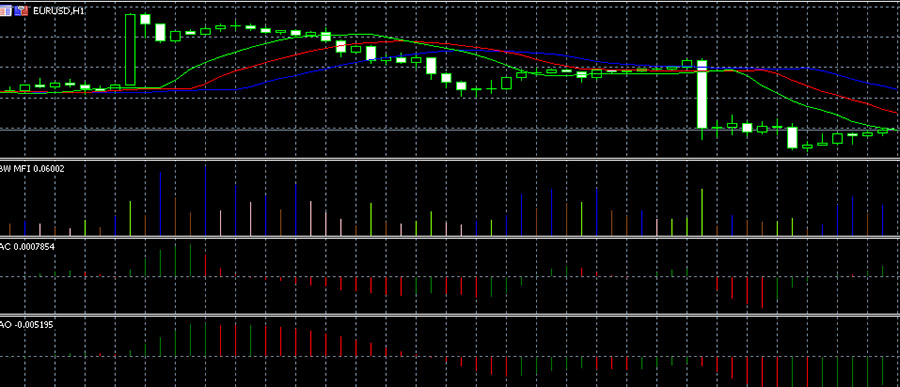
Another strategy with the MFI for short-term trading involves assessing the situation by other Williams indicators. Instruments are added to the chart “Parabolic.”, “Moving averages”, “Alligator” (Fig. 9). The signal to enter the trade is determined by the formation of a pink bar on the MFI, and other indicators confirm or deny this information.
Image. 9
The strategy is used on any timeframe, but preferable timeframes from 4H, because on a shorter time there are more false signals.
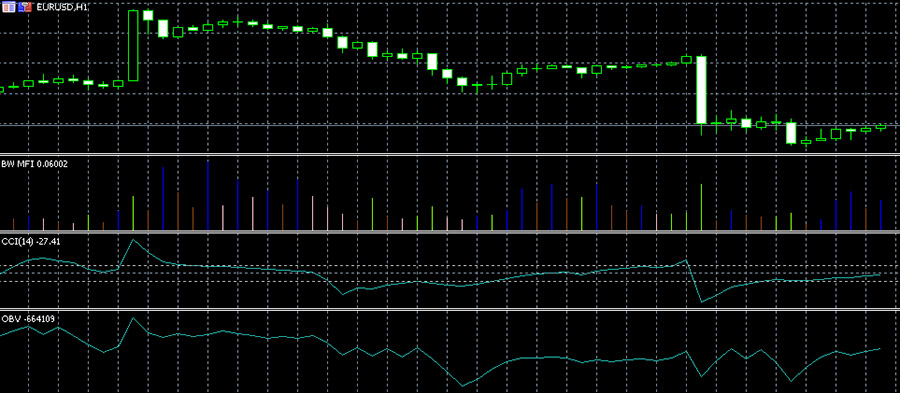
Three indicators, as if forming a single trading tool, are used in the following strategy. Standard indicators CCI, MFI and OBV (Fig. 10) should show maximum values, which is a signal to open and close a position, because the entry point is formed very clearly, at the intersection of the three indicators.
_
There is also a very simplified strategy that applies to some currencies on candlestick chartwhich uses only green MFI bars. You enter trades when a green bar is formed, taking into account which candle is formed, bearish or bullish, and the corresponding trade is opened.
The strategy requires significant trading skills, because it shows a lot of false signals, but their number decreases with the use of additional indicators. Also, this strategy requires prior practice on forex demo account and the selection of a suitable trading pair.
Conclusions
MFI indicator is a standard indicator from the series of tools developed by Bill Williams. It is mostly an analysis tool of the market situation, but it is also actively and effectively used in forex trading together with other indicators, because independently MFI does not show the optimal entry points into trading.
Reviews
-
2 December 2020 in 16:32
So what’s the divorce here?
