Haiken Ashi Chart
Contents
- 1 What does the Haiken Ashi indicator show
- 2 Setting up the Haiken Ashi indicator for trading
- 3 How to analyze a Haiken Ashi chart
- 4 Advantages and disadvantages of the Haiken Ashi chart
- 5 Example of working on the Haiken Ashi chart when trading binary options
- 6 Example of working on the Haiken Ashi chart when trading forex
- 7 Example of work on the Haiken Ashi chart when trading cryptocurrencies
- 8 Conclusions
What does the Haiken Ashi indicator show
Heiken Ashi (Fig. 1) is one of the not very often used charts to analyze the price of an asset. The Heiken Ashi chart is an analogue of Japanese candles, – they have a body and a shadow, the body shows the direction and stability of the trend, the shadows show highs and lows. But although Haiken Ashi and Japanese candlesticks are similar, they are not the same, so charts look different in the same situations.
The Haiken Ashi chart appeared in the markets recently and its appearance is associated with the need to clarify the information displayed by traditional Japanese candlesticks. The large amount of information displayed by Japanese candlesticks is often of a “noise” nature, which makes it difficult to determine the trend and predict the price behavior. Haiken Ashi was developed to solve this problem in 2004 and was so successful that it was soon included in the list of indicators of many trading platforms.
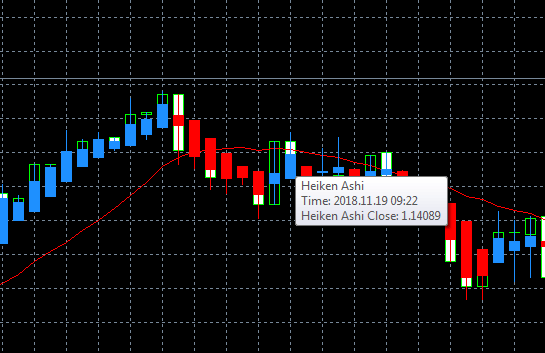
Fig. 1
On the Heiken Ashi chart, the opening price is the average between the opening and closing price of the previous candle. The closing price of a candle is formed from the average of the opening price, the closing minimum and the maximum. The maximum of a candlestick is defined as the maximum value of the opening and closing prices and the maximum value of the previous candlestick. The minimum is formed from the opening and closing prices and the minimum value of the previous candle.
The Heiken Ashi candle is formed near the center of the previous candle, so there are no gaps on the chart.
The averaging and connectivity of candlesticks allows to make the trend in which the price develops more clearly. When forming trend lines candlesticks on the chart have no or almost no shadows. Heiken Ashi candlesticks do not change color as often as Japanese candlesticks, so the trend on Heiken Ashi is more reliable.
On the Haiken Ashi chart before entering the trade, the trend must be confirmed by at least three candles of the same color, which indicate the development of the trend in one direction.
The direction of the trend is confirmed by the fact that the bodies of candlesticks are growing. If candlestick bodies shorten and shadows become longer, the trend is close to completion. A candlestick with a short body and long shadows on the chart is a strong reversal signal.
Setting up the Haiken Ashi indicator for trading
The Haiken Ashi indicator is not available on all trading floors. But, in particular, in the library of the Metatrader 5 trading terminal (https://www.metatrader5.com/ru) it is there. To do this, open the trading terminal. Open the drop-down menu “Insert”. Select the “Indicators” section (Fig. 2), “Custom” subsection and select the Haiken Ashi indicator from the list (Fig. 3). The indicator is set up in the same way as the Japanese candlesticks.
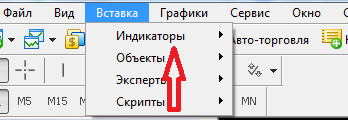
Fig. 2
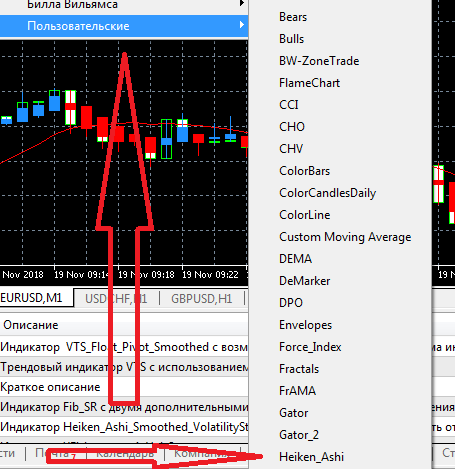
Fig. 3
How to analyze a Haiken Ashi chart
Heiken Ashi analytics is generally the same as Japanese candlestick analytics, all elements are present – channels, trend lines, resistance supportThe chart also forms typical patterns, but less than the Japanese candlestick chart.
Traders pay attention to the type of candles formed on the chart: a green (often blue, black) candle without a lower shadow shows a confident uptrend (Fig. 4); a candle with a short body and long shadows on both sides indicates a possible change in trend; a red candle also shows a change in trend; a red candle without an upper shadow shows a strong downtrend.
But individual candles are not sufficient reason to enter the trade, you should wait for confirmation of the assumed trend – candles of the same color or another.
Typical patterns on the chart include triangles, wedges, and Doges. Triangles can be symmetrical, ascending or descending. A symmetrical triangle is formed by converging symmetrical support and resistance levels.
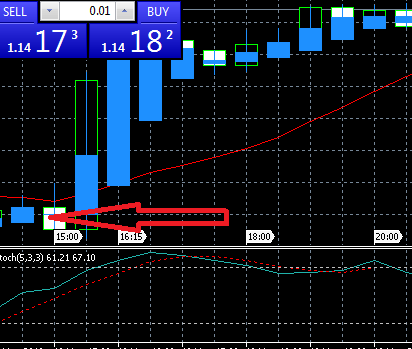
Fig. 4
This pattern shows the instability of the asset’s price dynamics, the trend can reverse or stay the same.
The divergent triangle is formed by symmetrical diverging lines and is also an indicator of an unstable market.
The horizontal resistance level and the ascending trend line form an ascending triangle. This pattern on the Haiken Ashi chart suggests that a breakout of the resistance line is imminent.
The descending triangle (Fig. 5) is formed by with a horizontal line support and resistance level of the downtrend. When creating such a pattern, traders are waiting for a breakdown of the support level.
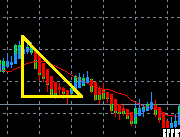
Fig. 5
Wedges are formed from Heiken Ashi candlestick extremums and are bounded by unidirectional support and resistance levels. If the wedge is formed against the trend, we can most likely expect a correction. Traders are waiting for a breakdown of the level in the direction of the changing trend, it may be the best time to enter the market.
Doji is a classic type of Japanese candle, which is also found in the Haiken Ashi chart. Since the opening and closing prices are equal, the candlestick has no or almost no body, but there are long lower and upper shadows of approximately equal size. The formation of the doge shows that the market is in an unstable equilibrium and you can expect the trend to change.
Since Heiken Ashi shows trends more clearly, the appearance of one candle opposite to the previous trend is enough to consider options for further action – but it is still not enough to start the action. For more confidence in the trend, the chart should be supplemented with oscillator information, such as stochastics (Fig. 6).
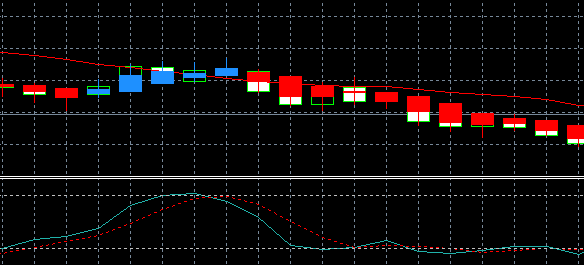
Fig. 6
Advantages and disadvantages of the Haiken Ashi chart
Heiken Ashi has all the advantages of Japanese candlesticks – they are clear, contain a large amount of information in a concentrated form, while they reflect the trend better than Japanese candlesticks, because they cut off unnecessary movements (noise).
The disadvantage of the graph is that it takes time to generate such clear information, so the graph is laggy.
To trade using this chart, it is preferable to choose assets with high volatility, because the smoothing nature of the chart can lead to the fact that the trader will not notice the price movements, significant for trading. For the same reason, it is advisable to use additional oscillators when trading with Heiken Ashi.
Therefore, when trading on the Heiken Ashi chart, it is advisable to keep the Japanese candlestick chart on, which will show the trend before it appears on the Heiken Ashi chart. This will reinforce the belief that the trend is valid and you can enter the trade. Basically, traders do not use Heiken Ashi only in trading. The main purpose of this type of chart is to confirm the trend.
Because of its characteristics, Heiken Ashi is not very suitable for working on timeframes less than 30 minutes, not suitable for scalping strategies. On the Heiken Ashi chart it is optimal to make intraday trades of several hours duration.
Example of working on the Haiken Ashi chart when trading binary options
В binary options trading different strategies of trading with Haiken Ashi charts can be applied, similar to Japanese candlestick strategies. To do this, it is necessary to first open the Haiken Ashi chart, for example, on the service Tradingview (Fig. 7) with parameters corresponding to bidding at Binary options broker.
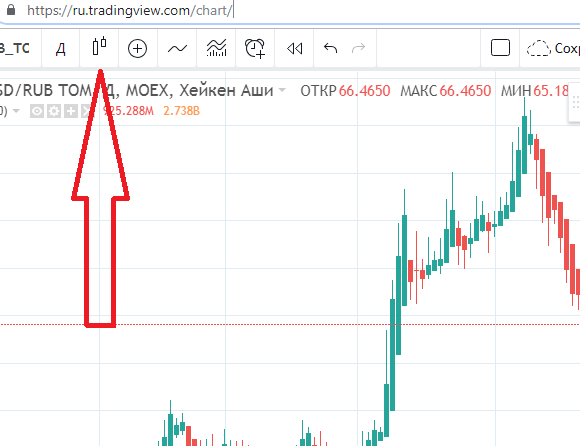
Fig. 7
One popular strategy is waiting for a reversal candle after a series of unidirectional candles.
The strategy, which is based on the Haiken Ashi chart, can be used not only for binary contracts, but also for other assets. It is carried out on the trading floor. First you have to choose a timeframe, for example, 5 minutes.
The trader can see a signal of a trend reversal – the lengthening of the candle shadow and the reduction in the size of the candle bodies confirm this. At this point, traders can purchase Call contracts.
If a red candle with an elongating body can be seen on the chart, it can be a signal to buy Put. To be more confident, traders can open two windows with Heiken Ashi on different timeframes – 5 minutes and one minute.
Log in to your binary broker’s terminal, study the available chart types and work with them:
| Broker | Bonuses | Open an account |
|---|---|---|
|
1
|
50 %
Bonus on deposit from $100 USD – promo code WELCOME50
|
Start |
|
2
|
5 %
Bonus when depositing via USDT (TRC20)
|
Start |
|
3
|
Cashback
Refunds of commissions, spreads and other costs
|
Start |
|
4
|
15 %
Bonus 15% on deposit by promo code iCGSbEgiAR
|
Start |
|
5
|
100 %
First deposit bonus
|
Start |
Example of working on the Haiken Ashi chart when trading forex
Trading strategies on the Heiken Ashi chart forex are the study of graphical shapes such as triangles, flags, “head-and-shoulders” and others. It is considered that the timeframe should be from 30 minutes to 1 hour, the asset must have an increased volatility.
When implementing the strategy, it is considered appropriate to use stochastic oscillator, which shows overbought or oversold asset, as Heiken Ashi shows only the direction of the trend. Stochastic allows you to compensate for the delay with which the chart shows price changes.
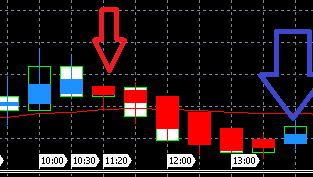
Fig. 8
When the candle on the chart changes color (Fig. 8) and simultaneously there will be an exit from the overbought Buy and Sell zones, it is considered appropriate to enter the trade on the next candle. When the stochastics show a trend reversal, the trade should be closed.
Simplified strategies are also used, such as selling when one candle predicts an increase, its body is longer than the previous candle, and it is followed by a similarly directed candle without a shadow. Buying is done in the opposite situation: the last completed candle indicates a downward trend, and the previous candle is also downward and has no upper shadow.
Log in to the forex broker’s terminal, study the available chart types and work with them:
| Broker | Bonuses | Open an account |
|---|---|---|
|
1
|
50 %
Bonus on deposit from $100 USD – promo code WELCOME50
|
Start |
|
2
|
From 25 To 60 %
Deposit increase for the first deposit
|
Start |
|
3
|
Cashback
Refunds of commissions, spreads and other costs
|
Start |
|
4
|
100 USD
Loyalty program remuneration
|
Start |
|
5
|
20 %
Bonus and cashback by promo code revieweek23
|
Start |
Example of work on the Haiken Ashi chart when trading cryptocurrencies
For cryptocurrency trading Haiken Ashi chart is quite suitable for periods when the volatility of cryptocurrencies is not too high. The chart shows upward and downward trends well, especially on long intervals, starting from one day, which allows predicting the dynamics of the coin’s price.
Among the strategies used by traders working with the chart is popular, for example, Moving average strategy. It is believed that if on a time interval of one day the 10-day moving average will cross the 20-day moving average, then you should buy coins and exit the trade as soon as a candle opposite to the current trend appears. But the Haiken Ashi chart is hardly there on the many crypto exchanges.
Enter the terminal of the crypto exchange, study the available chart types and work with them
| Exchange | Bonuses | Registration |
|---|---|---|
|
1
|
Until 4000 USD
Registration Bonus
|
Go to |
|
2
|
Until 10000 USD
Welcome Bonus
|
Go to |
|
3
|
2 USDT
Welcome Bonus
|
Go to |
|
4
|
1000 USDT
Bonus for futures trading
|
Go to |
|
5
|
0%
Fee for withdrawal to bank card
|
Go to |
Conclusions
Thus, the Haiken Ashi chart is a tool useful for trading any assets, mainly in terms of determining the direction of the trend. It is the use of this chart when trading with the help of Japanese candlesticks, as an additional tool, is optimal. If you intend to use Heiken Ashi as the main chart for trading, you will need additional charts. oscillators and indicators.