Japanese Candles Chart
Contents
What are Japanese candlesticks
The idea of presenting price dynamics in the form of a candlestick chart was invented by Homma Munehisa, a Japanese rice trader, in the 18th century. He studied the rice market for 15 years, many of the patterns of price changes he established and the conclusions he made are still relevant to all trading markets. Among Munahis’ achievements is his method of reflecting four prices at once in the form of “Japanese candlesticks” in one element.
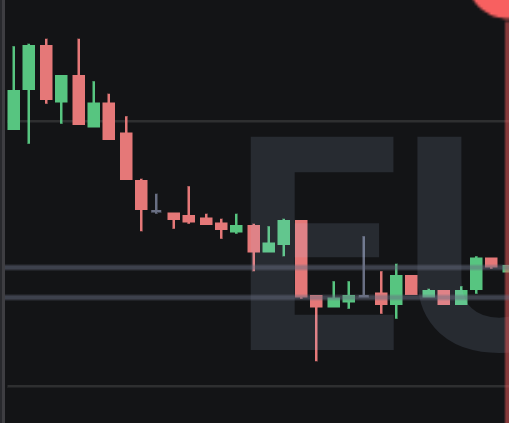
Fig. 1
Candlesticks (Fig. 1) come in black (colored, often red) and white (uncolored, often green) or contrasting colors on the same chart. The color indicates the trend prevailing in the analyzed time interval. Black or red indicates a decline, white or green indicates an increase. The size of a candlestick shows how much the price of the traded pair has changed. A candlestick has two “shadows” (wicks) at the top and bottom. They show the maximum values of price changes during a certain trading period.
Dodgy and the Marubozo Brothers
A doji (Fig. 2) is a type of Japanese candlestick important for determining price dynamics. It is a candlestick with a short body but long shadows. Ideally a doji looks like horizontal bar. This means that the opening price is equal to the closing price. This could mean that the situation in the market is frozen in indecision and is preparing for a reversal.
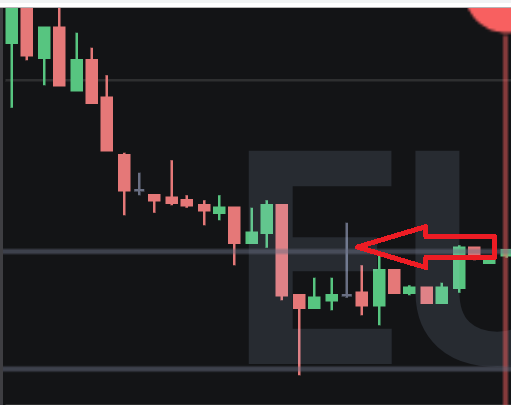
Fig. 2
But a doji can be considered formed not necessarily if it looks like a line. If the height of the pattern is 5 or more times less than the width, it is a doji. If such a candle is dark in color, it means that the opening price is slightly higher than the closing price. On the contrary, if it is noticeable that the candle is light, it means that the opening price was slightly below the closing price.
A doji indicates an impending trend reversal if it is located at the top or bottom of one of the chart patterns that make up the Japanese candlesticks.
Dodges that confirm a certain trend tend to turn into support and resistance lines.
Marubozu (Fig. 3) is a candlestick with a long body and no or almost no shadows, they are antagonistic and are also called Marubozu Brothers. Such a candle confirms the formed trend, upward or downward. The black (shaded) Marubozu proves the dominance of sellers in the market, the trades opened at the highs and closed at the lows. White (unpainted) marubozu shows the dominance of buyers, who drove prices from a minimum, at market opening, to a maximum, at closing.
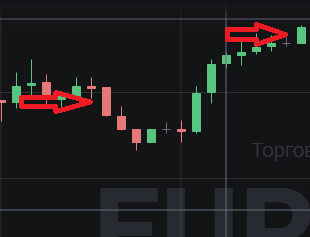
Fig. 3
Japanese candlestick patterns
Hammer
The “Hammer” candlestick indicates that a trend reversal is being prepared, from a downtrend to an uptrend. The color of the Hammer is not important. What matters is the shape of the body, which should be square or almost square, that is, it is a short candle. At the same time, the upper shadow is very short or may be absent, and the lower shadow is about twice as long as the body. Traders who recognize the Hammer on the chart expect a change in trend: either the downtrend will turn into a sideways movement or it will turn into an uptrend. However, the information that is reported by this figure must be confirmed by the next figure. A 180-degree unfolded Hammer on a downtrend means the same thing as the usual Hammer (Fig. 4).
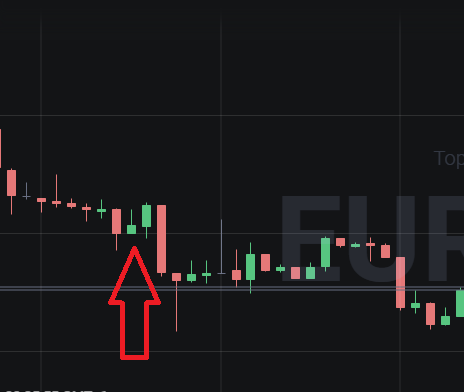
Fig. 4
The Hanged Man
The “Hanged Man” figure also refers to reversal combinations. It is similar to the Hammer, has a short body and a long lower shadow. The pattern is formed on an uptrend and signals its possible end.
The color of the body is important if the timeframe is short – the signal is considered stronger if the candle is black (shaded). You should also pay attention to the length of the candle – it should be twice or even three times longer than the body. The stronger the candle is, the shorter the upper shadow, the ideal “Hanged Man” candle – without the upper shadow.
Stars
Stars are configurations of several candles, which are strong trend reversal signals. A star almost certainly indicates a change in trend if placed at the top or bottom of a particular trend.
“Morning Star”, a pattern that signals a trend reversal. The pattern consists of three candles: a long colored candle, a long uncolored candle and a short candle between them. Between the candles in the figure, there must be a gap, a price break. The figure confirms the uptrend, if the price rises immediately after its appearance on the chart.
“Evening star” is antagonistic to the morning star. It consists of a shaded long candle, an unshaded long candle and a short candle between them – at the top. A gap is mandatory between the candles. The evening star indicates that a downtrend is starting.
Japanese candlestick analysis
In general, the analysis of Japanese candlesticks is reduced to the search for patterns on the chart, it allows you to spend less time and effort to develop and implement a trading strategy.
Japanese candlesticks have a lot of potential, but there are also limitations. For example, candlestick patterns are considered more effective on timeframes of an hour or more, although they are also used on other intervals (Fig. 6). Candlesticks are also suitable for analyzing movements on weekly and monthly charts.
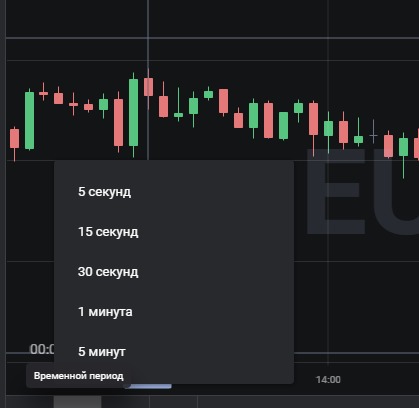
Fig. 6
Despite the fact that candlestick charts are called reversal charts, they do not always indicate a trend reversal. It can be the beginning of a new trend, different from the previous one, but not opposite to it. In particular, the market can go into a flat, and from the flat, for example, return to the same trend.
Japanese candles in binary options trading
Japanese candlesticks – the main types of charts on the binary options trading. Almost all classic Japanese candlestick patterns are used in the binary options market. But traders start practicing on the Japanese candlestick chart with simple strategies.
One of popular strategies – Double red. Realized on the five-minute timeframe. The trader assumes that two consecutive candles of the same direction confirm the direction of the trend. For example, a bearish candle appears on the chart, followed by a bearish candle, at a price below the minimum of the previous one. Presumably, immediately after that, the price will go up a little, and then the downtrend will prevail. At the moment of a short-term rise there is a probability to take the put at a better price. The call option is purchased in the opposite case, when two consecutive bullish candles are formed on the chart, the second of which is higher than the first.
Insider Bar Strategy (inside bar) is based on the “inside candle” pattern. The inside bar pattern is a candlestick that does not go beyond the previous candlestick, the shadows of the previous candlestick are considered to be its limits.
If a candle shows the direction of the trend, then you need to draw a horizontal line through the minimum or maximum of the first candle. Accordingly, if the trend is upward, the line is drawn along the maximum, and after the breakdown of this line, it is possible to buy an option, counting on the expiration time to close. In a downtrend, the actions are carried out in the opposite order.
Log in to your binary broker’s terminal, study the available chart types and work with them:
| Broker | Bonuses | Open an account |
|---|---|---|
|
1
|
50 %
Bonus on deposit from $100 USD – promo code WELCOME50
|
Start |
|
2
|
5 %
Bonus when depositing via USDT (TRC20)
|
Start |
|
3
|
Cashback
Refunds of commissions, spreads and other costs
|
Start |
|
4
|
15 %
Bonus 15% on deposit by promo code iCGSbEgiAR
|
Start |
|
5
|
100 %
First deposit bonus
|
Start |
Japanese candles in forex trading
Japanese candlesticks are actively used in forex trading (Fig. 7), where there are also many strategies developed for them. In particular, the Elephant and the Moose is among them.
Fig. 7
To implement this strategy, you need to have three candles on the chart: for example, a black doji, which demonstrates a change in the trend; a white candle with a large body, which shows where the trend is moving; and a white candle with a smaller body. The closing price of the second, small candle, must be greater than or equal to the maximum price of the previous candle. A buy trade is opened at the formation of the next candle. The sell strategy works, starting with a white doji and two black candles – a large and a small.
The absorption trading strategy is based on the classic Japanese candlestick pattern “Absorption”.
This pattern consists of two candles, with the first candle having a smaller body than the second. The candles are colored differently. The order of the candles in the pattern shows in which direction the trend will develop.
In this pattern, the second, larger candle, absorbs the first, with a smaller body, that is, on the chart, the large candle closes the smaller one. However, if the small candle has shadows, then the big candle may not cover them, but if it does, then the signal for a change in the trend is considered to be stronger.
So, for example, on a downtrend a pattern of absorption is formed, in which a white candle absorbed a black one. Then it is necessary to wait for confirmation – a doji with a shadow below or a repetition of the absorption in the same trend. A buy trade is opened on the next candle.
Log in to the forex broker’s terminal, study the available chart types and work with them:
| Broker | Bonuses | Open an account |
|---|---|---|
|
1
|
50 %
Bonus on deposit from $100 USD – promo code WELCOME50
|
Start |
|
2
|
From 25 To 60 %
Deposit increase for the first deposit
|
Start |
|
3
|
Cashback
Refunds of commissions, spreads and other costs
|
Start |
|
4
|
100 USD
Loyalty program remuneration
|
Start |
|
5
|
20 %
Bonus and cashback by promo code revieweek23
|
Start |
Japanese candles in cryptocurrency trading
The Japanese candlesticks are the main chart on the crypto exchangesBut crypto traders do not follow patterns too closely because cryptocurrency prices change too quickly. At cryptocurrency trading It is also difficult to predict price movements for a week or a month, which is what Japanese candlesticks are best suited for. However, if volatility is not too high, cryptocurrencies are traded using the same patterns as any other asset.
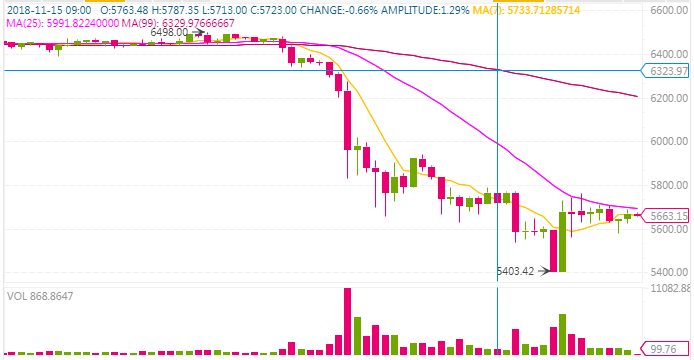
Fig. 8
One of the easiest ways is to trend tradingwhich is used by the vast majority of traders. The essence of the strategy is to accurately identify the reversal configuration of the candles and make bets to buy or sell – according to the identified trend.
More complicated is counter-trend trading. This is a short-term type of trading in which traders mark the figures that are most likely to confirm the trend, such as stars, and try to “catch” the profitable price of the asset on the rebound. But most often crypto-traders trade against the trend without taking into account the analysis of Japanese candlesticks in order not to lose time.
Enter the terminal of the crypto exchange, study the available chart types and work with them
| Exchange | Bonuses | Registration |
|---|---|---|
|
1
|
Until 4000 USD
Registration Bonus
|
Go to |
|
2
|
Until 10000 USD
Welcome Bonus
|
Go to |
|
3
|
2 USDT
Welcome Bonus
|
Go to |
|
4
|
1000 USDT
Bonus for futures trading
|
Go to |
|
5
|
0%
Fee for withdrawal to bank card
|
Go to |
Example of trading using Japanese candlesticks
Three Candles Strategy
As part of a strategy, such as in binary options, the trader looks for a Three candle pattern in which the highs and lows of the middle candle are respectively below the highs and lows of both candles on the sides.
Such a pattern occurs more often during the correction of the price after the trend was developing in one direction, and then there were two identical Japanese candles against this trend – it can be a correction.
In this case, it is important to see two candles, – and after them immediately the third, confirming the trend. And at this point it is necessary to bet on an increase in the quotation. In this case, it is three green candles.
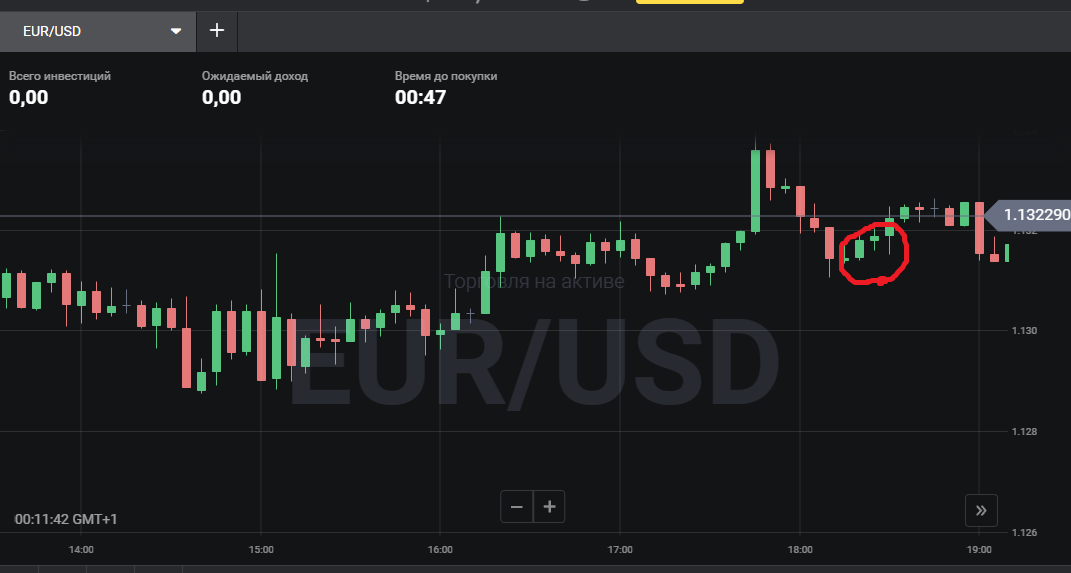
Fig. 9
If the trend is moving in a downward direction, the three candles also work, but you have to bet on the decline (10).
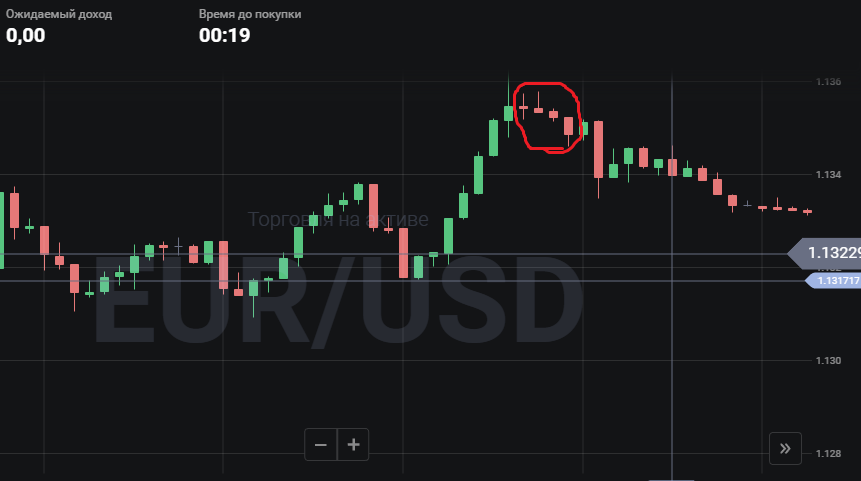
Fig. 10