Double CCI Oscillator Trading Strategy
Commodity channel index (aka CCI) is a popular oscillatorThe indicator is used by traders to find the best entry point into the market. This is the difference of this category of indicators from trend tools, which are usually used to assess the overall market situation.
Contents
In this article we will look at trading strategywhere the core is two variants of the CCI oscillator, and the Adaptive Moving Average will be used as an auxiliary filter.
Review of indicators and strategy
The main system is two modifications of the Commodity Channel Index – Weighted CCI and Transformed. The Adaptive MA from Perry Kaufman plays an auxiliary role. Let’s consider each indicator in more detail.
CCI with Volume Weighted EMA – A slightly improved version of the classical Commodity Channel Index. Its difference is that in addition to averaging, this oscillator also “weighs” the price bars. Without going into the details of mathematical formula calculation, we can note two key advantages of this tool. Firstly, its value better reflects the situation on the market when volatility changes rapidly. If there is a sudden price leap, the indicator will quickly react on it. Secondly, the presence of the weighting formula allows to increase signal accuracy in the conditions of attenuation of explicit cycles and smoothing of the amplitude of price fluctuations.
Inverse Fisher Transform CCI – an ultra-sensitive oscillator, which can be conventionally compared to an indicator Parabolic SAR. Instruments work on completely different principles, but there is a common point uniting them, it is binary, the absence of a neutral phase. The IFTCCI practically does not show the middle state of the market, and immediately passes into the oversold or overbought condition. This feature allows you to determine the specific points to enter the market. The indicator reveals itself well in combination with other oscillators, but not as an independent tool.
Moving Average Adaptive (AMA) – A moving average by Kaufman, created by him in 1995. The idea to develop this tool came to its creator when he repeatedly observed the problem of chart scaling when analyzing trends of different intensities. Perry Kaufman decided to solve this problem by creating a moving average, which itself would adjust to the dynamically changing market conditions and save the user from the need of manual adjustment of scale. The practical benefit of this indicator is that it is suitable for market analysis not only in the active trend phase, but also in the flat time.
Setting up the chart and the trading platform
The strategy is universal – for the analysis we use a public platform from TradingView. It is recommended to trade in the terminal of INTRADE.BAR. This site is at the top of the rating for ease of trading and level of trust.
Step-by-step instructions on how to set it up:
- Open “live schedule” from TradingView. Also in the next tab you should open a web terminal for trading, for example Intrade.Bar (https://www.intrade.bar). If necessary, log into your account or register, it takes 1 minute.
- In both tabs we choose one asset – the one with the highest return. But CRYPTO IDX is not suitable for this strategy, since it is an integrated asset of INTRADE.BAR and is not available in the TradingView terminal. We set the candlestick mode with a timeframe of 1 minute.
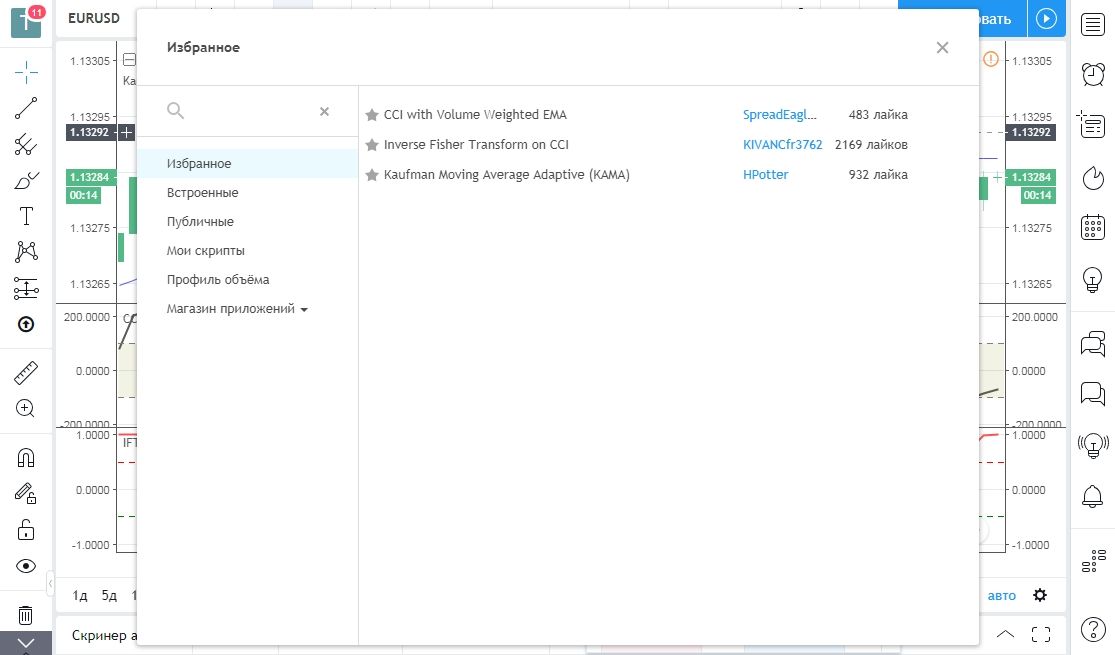
- Let’s add three indicators to the TradingView platform: “CCI with Volume Weighted EMA” (10), “Inverse Fisher Transform CCI” (5, 9) and “Kaufman Moving Average Adaptive” (21). To do this, copy the names from the quotes one by one and paste them into the search bar.
- Setting up indicators according to the values in parentheses in the previous paragraph next to the instrument names. Some of them will already initially have the desired period. It is also possible to increase the thickness of the lines to a comfortable size in order to facilitate the visual perception.
Trading signals by strategy
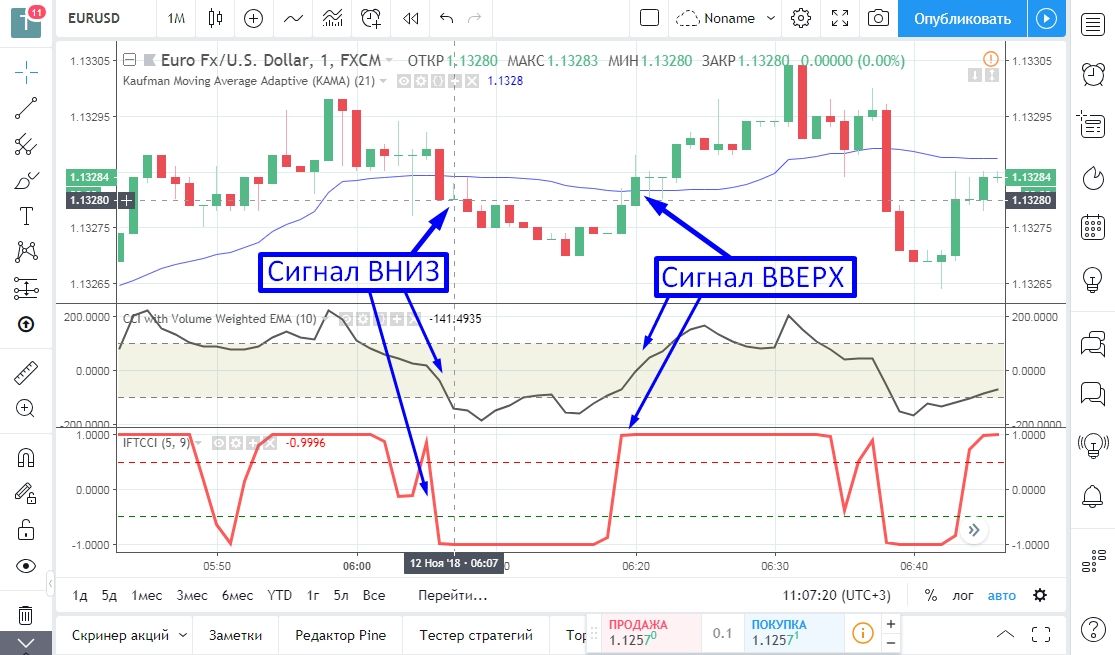
The trader should closely monitor the price movement. As soon as the candles approach the Moving Average Kaufman curve, then one should carefully monitor the values of the oscillators. At the moment of breakdown of the line, subject to confirmation from the CCI, one should enter the market.
Signals:
- On the rise – The green candle breaks through KAMA, and the CCI oscillators move into overbought zone (above).
- On the downgrade – The red candle breaks the KAMA curve, and the CCI moves into the oversold area (below).
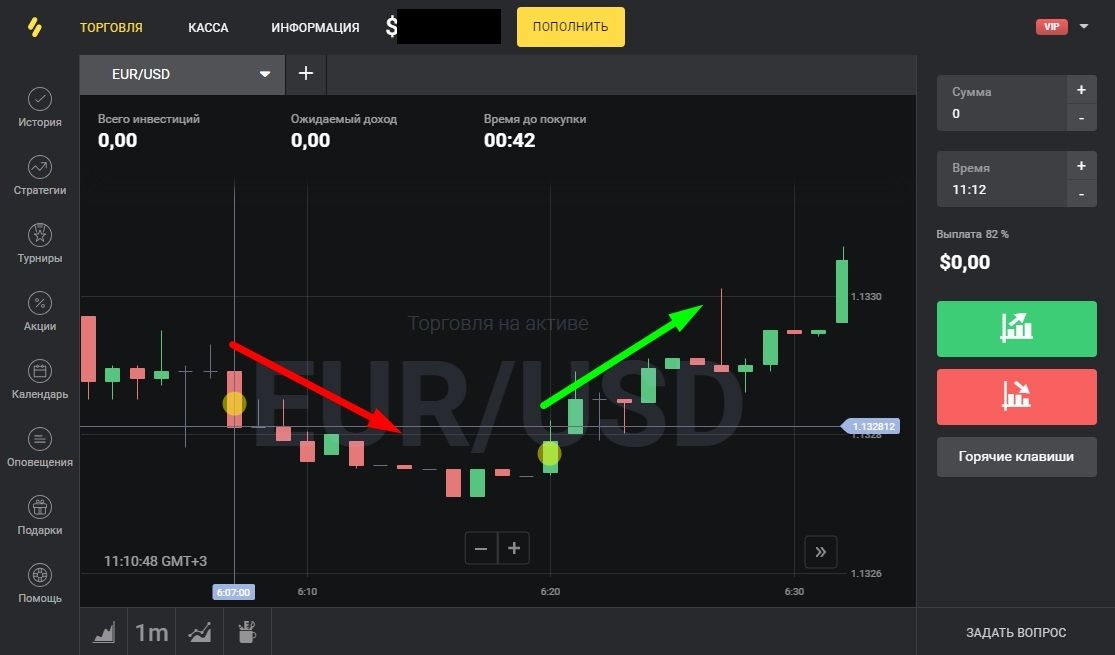
As soon as a signal appears and a candle that broke the MA curve closes, you should go to the tab with INTRADE.BAR and open a trade. The picture below shows the same fragment of the chart as on the TradingView platform above.
Expiry date The footwear should be chosen on the 5 minutes. Before opening a deal in the Intrade.Bar terminal, in the drop-down list of the “Time” parameter, you should select the fifth option marked in orange. As a result, the actual duration of the transaction will be 4 to 6 candles, which is quite enough to make a profit on the signal of these indicators.
Reviews
all a scam, no profit will be withdrawn, the deal is canceled as opened at a non-market quote.