Short-Term Strategy for INTRADE.BAR “Águila”
The potential of Moving Averages (detailed indicator reviews: SMA, EMA, WMA) is literally inexhaustible. On our website we have already reviewed many strategies based on these indicators, but we can’t say that this topic is fully covered. Today we are going to look at another system suitable for Intrade.Bar terminalwhich can be called really simple, but at the same time ingenious.
Contents
It has high efficiency and allows you to trade on the second charts without spending a lot of time trading.
Review of TMA and TSMA indicators
The system uses Two moving averages with different formulas of calculation. For effective trading it is not necessary to understand all the nuances of the tools, so we will not go into the mathematical details of the formulas, but consider them from a more practical point of view.
Triangular Moving Average (TMA). This is an exponential MA curve with double smoothing. This peculiarity of the formula is visually noticeable. It is the smoothest line that is physically unable to make an angular reversal even with sharp jumps in volatility.
Time Series Moving Average (TSMA). It is easy to understand the principle of calculation of this Moving Average in comparison to the SMA. The standard averaging formula allows you to calculate the arithmetic average of all selected values. For example, SMA with period 50 does not separate price bar with number 1 and 49, they are equal. This distorts the final position of the line on the chart. The TSMA formula eliminates this disadvantage. The “time seres” have been introduced, which gives the greatest importance to the nearest price bars and the least importance to the last price bars in a period. This reduces the lag of reversal bars. trading signals.
Preparing INTRADE.BAR platform
One of the main advantages of the INTRADE.BAR platform (Open a demo account) is the possibility of short-term trading on the interval chart with a timeframe of 1 second. Classic strategies using professional platforms for theanalysis, such as Live-chart TradingViewrequire a minimum of 5 minute or 15 minute expirations. Therefore, it takes many times more time to trade than it does to trade turbo contracts for 60 seconds. The “Aguila” strategy uses trades with a time frame of 30 to 90 seconds, this is the minimum expiration in the terminal intrade.bar.
A step-by-step setup of Intrade.Bar for the “Aguila” strategy:
- open the site and select CRYPTO IDX;
- set up a 5-second chart in candlestick mode;
- we add two moving average curves.
The default expiration time of the contracts is set at 1 minute and does not need additional correction before entering the market.
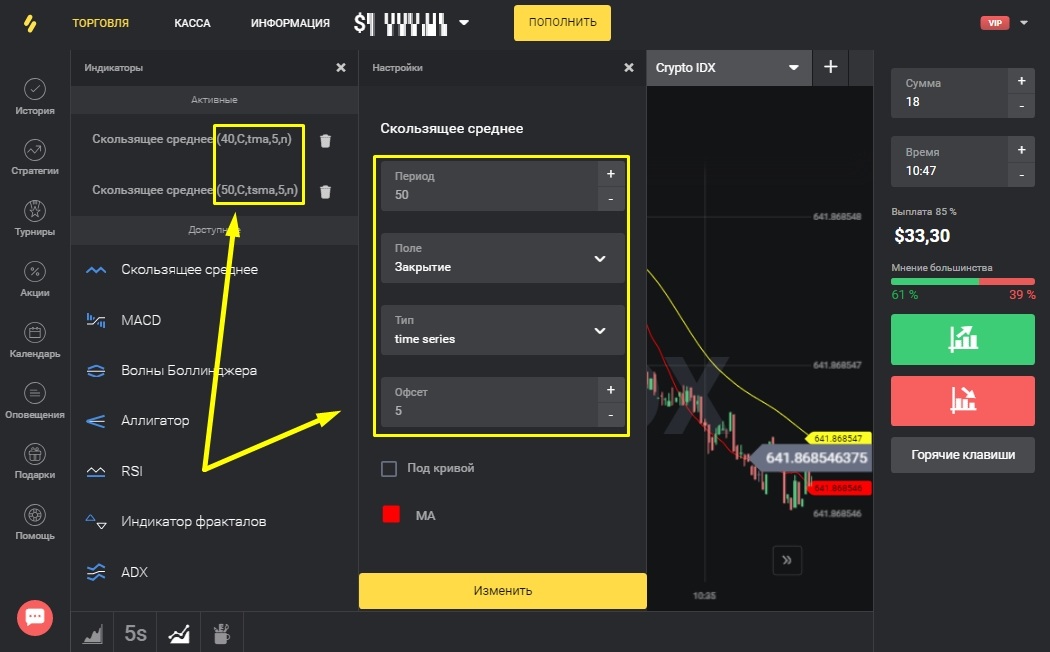
Moving Average parameters:
- Line #1: period – 50, fill – red, offset – 5, type – time series;
- Line #2: period – 40, fill – yellow, offset – 5, type – triangular.
It is necessary to determine the value of the contract in advance and specify the appropriate value in the “amount” field. Its size should not exceed 4-5% of the total balance of the trading deposit. This is the upper risk limit. The recommended value of the contract – from 0.5% and below. But it is possible only on deposits with the size from 100-200$. This is a clear confirmation of the fact that traders with a small deposit, due to technical limitations, are forced to take more risk, while receiving less profit.
Signals by strategy
Beginner traders only need to understand the principle of trading with moving averages for the first and only time, so they do not need specific step-by-step instructions anymore. The advantage of linear indicators is their extreme simplicity. What can be easier than simply tracing the point of intersection of 2 lines with each other? But in practice, in addition to the intersection, other nuances play a role, which allow us to detect false signals. So let’s take a look at the key points of trading with the Aguila strategy.
Signals:
- on the rise – the red TSMA breaks through the light TMA and takes the top position;
- on the decline – the red line goes down and the yellow line goes up on top of it.
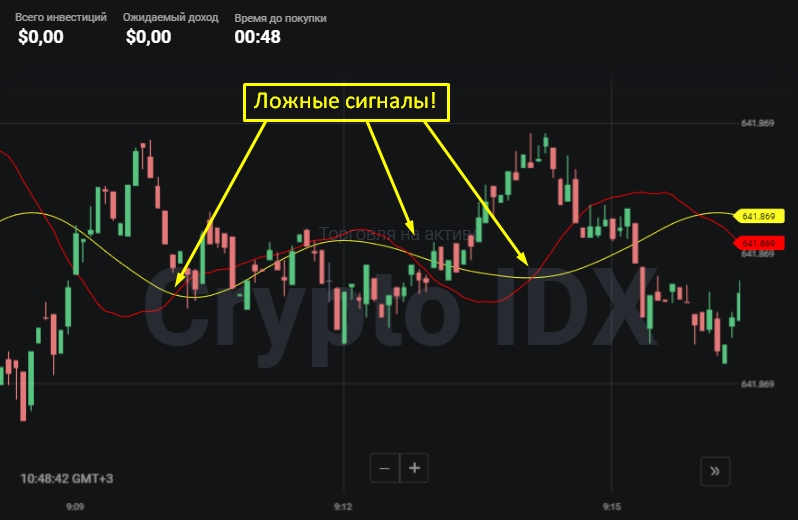
The signals are clearly shown in the picture above. Trading on them is very easy, but before entering the market you should make sure that there was a real market reversal and not a short-term fluctuation, which is “price noise”. There are several criteria for this.
Conclusion
It is the need to differentiate real signals from false ones that is the main reason why trading is still not automated. There are too many factors to take into account, and as a trader accumulates experience it is done almost automatically on an “intuitive” level.
Firstly, the frequency of moving averages crossing plays a role. If it happens more often than once in 2-3 minutes, the probability of false triggering increases significantly. Secondly, the key point is the distance between TMA and TSMA on the eve of crossing and the intensity of price deviation from the lines. The less these indicators are, the worse it is. For illustration, the screenshot above shows a typical example of several false positives of the indicators.
Reviews