Horizontal Line on Stock Charts
Contents
What is a horizontal line?
The horizontal line (Fig. 1) on charts of trading any assets is used for visual ordering of data on price fluctuations. Lines serve to give the trader a more accurate picture of the processes occurring in the market.
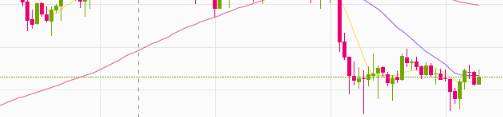
Image 1
Horizontal lines emphasize the boundaries of price waves, extremums, mark the places of transactions, it allows you to determine the entry and exit points.
Horizontal lines, despite their simplicity, can be a very effective trading tool, but they must be drawn through some important points, which you still need to know how to determine.
Each trader uses horizontal lines at his discretion, any number of them can be put on the chart, but most often horizontal lines are used to indicate support and resistance levels.
Support and Resistance Levels
Defining support and resistance lines (sample strategy) belongs to the absolutely necessary skills of a trader practicing technical analysis.
The price minimum and maximum points are determined on the chart. Straight lines are drawn through these points. Accordingly, the line passing through the minimum values is the support level, the line passing through the highs is the resistance level.
Simply put, the support and resistance lines reflect the struggle of traders who trade to increase the price of the asset (bulls) against traders who trade to decrease the price of the asset (bears). That is, these lines are not purely technical indicators, but an indicator of market sentiment, a reflection of the prevailing at a certain moment of trading psychology of traders.
The support level shows below what price the bulls will not let prices fall, the resistance level shows above what price the bears will not let prices rise.
From the resistance line, sellers can sell prices to fall further, and from the support line, buyers can turn prices to rise.
After a breakout and a clear trend is established, the support line becomes the resistance line and the resistance line becomes the support line.
There are typical events on the support and resistance lines, and traders open and close trades based on those events. A breakout is one of those events and we can say that traders’ main job is not to miss a breakout of one of the horizontal levels. The breakout shows in what direction the trend will develop further.
If the resistance line is broken, the trend is upward, prices are rising; if the support line is broken, the trend is downward, prices are falling. The moment of breakdown can be a good entry point into the market.
When the price touches the support or resistance line, traders also track it – in this case, the price approaches the line, but does not break through it. If the trader analyzes the candlestick chart, the shadow of the candlestick may touch the line (a candlestick consists of a body and a shadow above and below, more details about candlesticks at the link: https://revieweek.com/charts/candlestick/) This is an indication that the market is in an unstable state, trades are not made by touching the line. A touch is not a signal to sell or buy, but it is a signal that a trader should be alert, because a candle touching a horizontal line can turn into a breakout when the candle crosses the line with its body.
A breakout of a line does not lead to a continuous rise or fall in price, traders track corrections after the breakout, which can be false, and the price will go back up. Each successive support and resistance line is replaced by a new one, until it finally settles on some steady level. The difficulty is that the trader must determine at what point a stable level is formed.
On a candlestick chart, traders, after seeing a candle body crossing a level line, wait for the trend to be confirmed by the next candle in the same breakout direction. If this happened, it means that the breakout was not false. If the candles line up without completely crossing the line, the trend is not considered to be formed, and traders in any case, wait for a complete crossing of the line and confirmation of the trend with the next candle.
Support and resistance levels in forex
Support and resistance lines for forex are part of the set of indicators on the trading floors. There are several such indicators on MT5. In order to use them, you need to go to the “Library” section, find and select the desired indicator (Fig. 2).
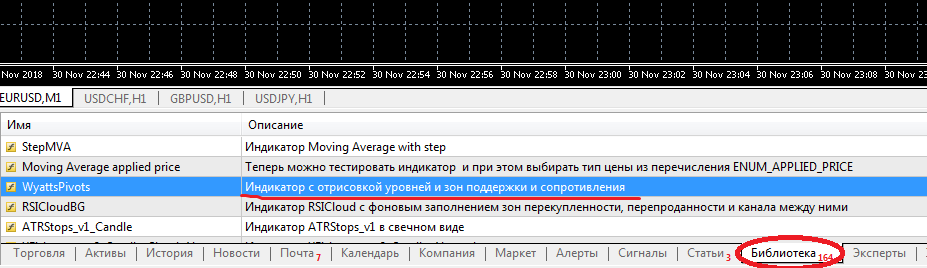
Image. 2
Or download the indicator from third-party sites, asking on the forums beforehand, which indicator has proven itself in profitable forex trading. The indicator is loaded through the editor and launched in the trading platform through the list of indicators (Fig. 3), which should be entered through the “Insert” section. The indicator is attached directly to the chart by right-clicking.
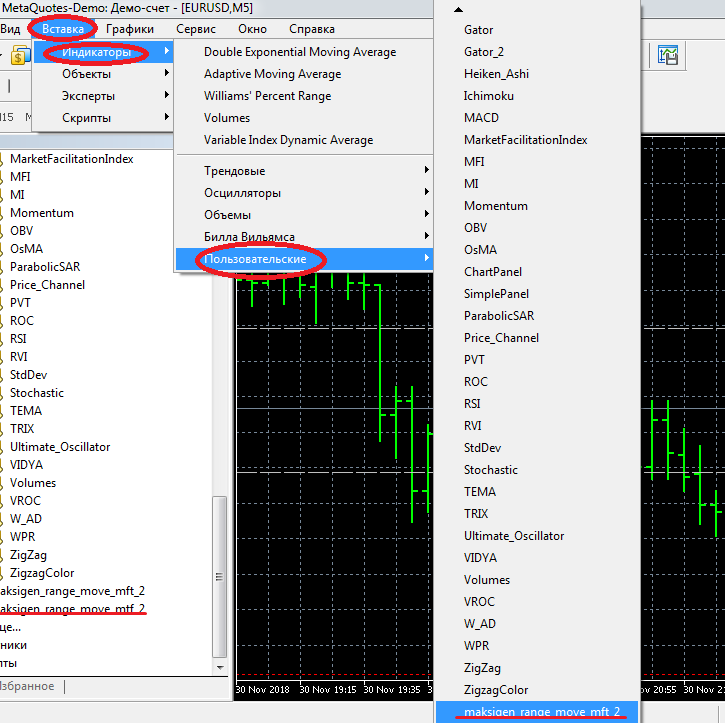
Image. 3
There are many ways to trade with resistance and support lines (Figure 4), but they all involve tracking the breakdown of the line.
For example, the trader assumes that the price approaches one of the lines. He switches to a shorter timeframe in order to see smaller price fluctuations more accurately, so as not to miss the moment of breakout and not to confuse it with a touch. At the moment when the breakout occurred, you should wait for its confirmation by the next candle in the direction of the breakout, which will indicate a trend reversal, or be prepared for the price to return behind the line, and then again try to break through the resistance and support lines.
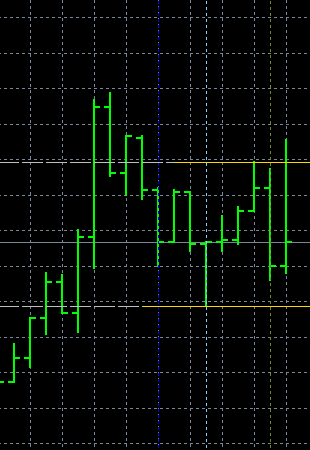
Image. 4
In all three cases: testing the line, rebounding from the line, and true breakout, traders can enter into sell or buy trades depending on the direction of the trend. And in all cases, stop losses must be placed. This strategy is popular, it is conducted on timeframes of about 1 hour and can be automated.
Support and resistance levels for binary options
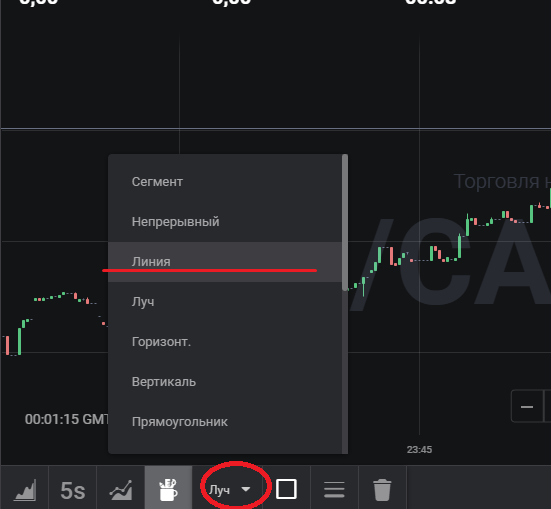
Image. 5
On trade binary options platforms lines are included in the standard set of tools. In particular, in the broker’s terminal Binomo (bonus 100% to deposit by promo code REVIEWEEK100 – Activate) line is located in the “Elements” section.
Trading strategies along the lines at binary options are quite popular. For example, traders determine an uptrend by the highs and lows that are above the previous marks. Optimally, if the trend line passes through the lows. Next, traders track a correction. That is, a rebound from the support level. It should be confirmed by several candles. If all conditions are met, traders buy a Call option.
Similar actions are carried out when the price bounces off the resistance level, then a Put option is purchased. A clear downtrend is identified on the chart, confirmed by a line passing through the highs on the downtrend. Traders track the correction and rebound from the resistance level. After that, a buy trade is made.
Another strategy is to buy Call from the resistance line, which becomes the support line, and buy Put from the support line, which becomes the resistance line.
In the first case, the trader tracks and confirms a clear uptrend and prepares to break the nearest resistance level (with confirmation that it is a true break) and the resistance line has become a support line. When this happens and the price breaks away from the new level, the trader buys a Call option.
In the second case, a clear downtrend is recorded on the chart and a breakout of the nearest support level is tracked. This breakdown is confirmed by several candles or bars. The price returns to the level of resistance and on the rebound an option Put is bought.
These strategies are used on highly volatile assets, provided that the trends are clear and the trader is able to accurately identify the true support and resistance levels.
Support and resistance lines on cryptocurrency exchanges
Cryptocurrencies – A highly volatile asset, so on the crypto exchanges trading along the lines is of particular importance. Emotions of crypto traders experience great fluctuations, and following them, the price of cryptocurrency experiences great fluctuations. Traders’ behavior is strongly influenced by news background or just absence of positive news, situation on one crypto exchange or a statement of some authoritative expert in cryptonomics.
This is especially evident when the trend becomes downtrending. Almost always the downtrend in the crypto market is very deep and long compared to the growth period, crypto traders sell off assets uncontrollably and prices fall very hard.
Therefore, the main strategy when trading on the crypto exchanges can be considered trading on the bounces with stop-losses.
In cryptocurrencies, levels are used to determine the entry point, trading limits, as well as the channel in which the trade runs more or less comfortably.
On crypto exchanges, the line of support and resistance can be in the list of standard indicators, for example on Binance. In order to use it, you need to enter the “Advanced” terminal on the main page of the exchange, and in the “Draw” section, in the drop-down menu, find the appropriate line (Fig. 6).
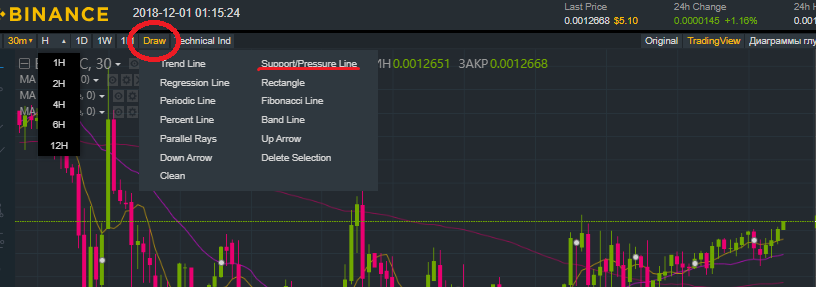
Image. 6
There is another factor to consider on crypto exchange – whales. Whales are large traders who can influence the exchange rate, including false breakouts when the price breaks the line for a short period of time. Since volatility is high, traders do not have time to properly verify that the breakout is valid and make the wrong trades.
To prevent this, you need to put stop-losses, which need to be constantly adjusted, and use hidden limits, because whales track at which cutoffs traders put stops and knock them out. In addition, a breakout during cryptocurrency trading should be confirmed with information from other indicators.
As you can see, the nature of crypto trading is such that each resistance and support line requires confirmation. At the same time, trading on bounces and false breaks can be more effective than the same trading in other assets. Small movements – taps, at trading on a cryptocurrency exchange We need to pay more attention to it.
Before trading on the lines, you should check to see how actively traders are trading, the volume of trades near prices close to resistance and support lines. High volume is a good signal for finding an entry point into trades.
In general, trading any assets based on support and resistance lines has no fundamental differences, the same strategies and the same behavioral patterns are applied.