Bulls Power and Bears Power Oscillators
Contents
“Bulls and Bears
In the currency market, there is a constant struggle between the buyers – “bulls” who raise prices and the sellers – “bears” who lower prices. At the end of the trading day the price of the asset becomes lower or higher than on the previous trading day. If it is higher, the “bulls” have taken the initiative and prices will rise; if it is lower, the “bears” have managed to impose their terms on the market and prices will fall.
But is it possible to determine when the market begins to be dominated by buyers or sellers? To solve this problem, one of the most famous and respected traders in the world, Alexander Elder created two oscillator for forex (Fig. 1): Bears Power, reflecting the superiority of the Bears, and Bulls Power, showing the dominance of the Bulls:
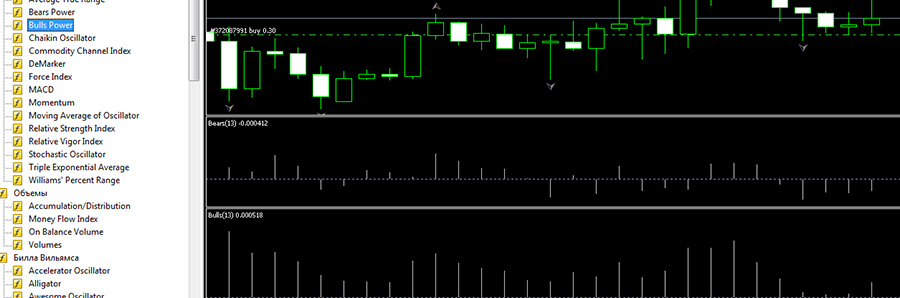
Image. 1
In the trading terminal, they are placed at the bottom of the price chart as histograms. These indicators are quite popular, they are considered classic tools for forex trading.
Enter the broker’s terminal, add the Bulls Power and Bears Power oscillators to the chart and see what comes out
| Broker | Bonuses | Open an account |
|---|---|---|
|
1
|
50 %
Bonus on deposit from $100 USD – promo code WELCOME50
|
Start |
|
2
|
From 25 To 60 %
Deposit increase for the first deposit
|
Start |
|
3
|
Cashback
Refunds of commissions, spreads and other costs
|
Start |
|
4
|
100 USD
Loyalty program remuneration
|
Start |
|
5
|
20 %
Bonus and cashback by promo code revieweek23
|
Start |
Description of the Bears Power oscillator
The situation when the balance of power in the market is in favor of the bears is determined by the Bears Power oscillator. It is based on Alexander Elder’s assumption that moving average shows the balance between “bulls” and “bears” for a certain period of time, and the minimum price shows the strength of the “bears”. The author suggested to take a period of 13 days as a basis. As a result, the formula for calculating the tool looks like this:
PB = LOW – EMAwhere:
- PB is the power of the Bears;
- EMA – exponential moving average, fair price in the calculation period;
- LOW – the minimum price of the current bar.
In the exponential moving average, prices at the end of the period have the most noticeable influence on the oscillator indicators, which allows us to evaluate Bears Power quite correctly. If the values of this forex indicator below zero, price lows below the EMA, it shows the growing strength of the “bears”, if higher, price lows above the EMA, then the “bears” give up positions, trend The zero mark represents an “equilibrium” situation between buyers and sellers. The zero mark represents a “parity” situation, an equilibrium between buyers and sellers.
The most positive signal for the bears is when in a downtrend, the next lowest oscillator reading is lower than the previous reading and coincides with the price movement. This can indicate that the bears have gained a lot of strength and will continue to push the price to make new lows. If price has updated the low, but the next oscillator low is higher than the previous one on the histogram, it may indicate that the bears are weakening and we should expect a trend reversal soon.
The Bears Power oscillator itself is designed to determine Forex signals only to buy the asset. The Bears Power indicator is rarely used in trading without other indicators, because with all its merits it does not show the sellers’ strength with one hundred percent accuracy. In particular, volume is not considered in calculations, which does not give a complete picture of the market situation, so it would be imprudent to use the Bears Power signals in trading decisions. It is more useful as an indicator showing the most probable trend direction. The Bears Power oscillator is most frequently used with trend indicators, mainly with a moving average of some type.
Bulls Power oscillator description
The Bulls Power indicator mirrors the Bears Power. It is determined by the formula:
PB = HIGH – EMA, where:
- PB is the power of the bulls;
- EMA – exponential moving average, fair price in the calculation period;
- HIGH – the maximum price of the current bar.
On an uptrend HIGH is above the EMA, the oscillator readings are above zero line, it shows the growth of “bulls’ power”. If on the downtrend HIGH is placed below the EMA, the oscillator indicators are below the zero line, it indicates the weakening of the “bulls’ strength”, which gives the “bears” an opportunity to intercept the initiative.
Bulls Power is used to analyze the market situation in order to determine the moment of the beginning of a trend. But the Bulls Power signals are aimed only at selling the asset. Like the Bears Power, the Bulls Power oscillator should preferably be used with trend indicators. Of course, often both oscillators of power are used together, because they were invented as complementary.
The Bull Power and Bear Power oscillators are included in the list of standard in the trading terminals. In MT5 they are placed in the navigation panel on the left side of the price chart (Fig. 2). In the indicator settings you can change the period:
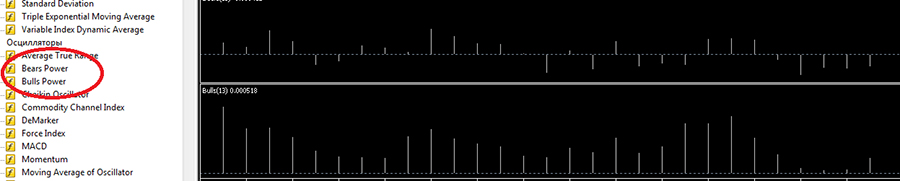
Image. 2
Trading strategies based on Bull Power and Bear Power
Bull Power and Bear Power oscillators are used in Forex strategies to determine entry and exit points in situations of “price overshoot”, i.e. “price overshoot”, when the price is very far from the average values (over the scale).
For example, Bear Power is used on an uptrend to track the moment of maximum dominance of “bears” in order to enter the market on the rise in price. Also, these oscillators are used to determine the exit points from the market, and the position selection on an uptrend is made with Bulls Power, and on a downtrend – with Bears Power.
Bears Power and Bulls Power oscillators are most often used together with trend indicators, such as exponential moving average, EMA (Fig. 3), which is needed to determine the direction of the trend:
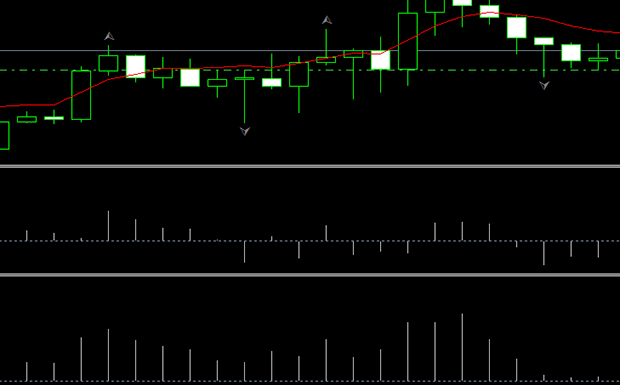
Image. 3
On the downtrend, which is shown by the EMA, the Bulls Power oscillator shows a sell signal when the Bulls Power indicators are above the zero mark, but begin to decline. Also, the Bulls Power oscillator data does not confirm this trend and shows that the trend can change to a downtrend, while the Bulls Power oscillator data does not confirm this trend and shows that it can change to a downtrend. At the same time, a sell position is opened when the Bulls Power readings are below zero.
For example, to implement this strategy, an exponential moving average with a period of 34 is set, while a period of 68 is specified for Bears Power, and a period of 164 for Bulls Power. The EMA crossing the price from bottom to top will be a signal to buy, the Bears Power histogram indicators must be below zero level, but must show growth. The signal for selling will be the EMA crossing by the price from upside down, the Bulls Power oscillator readings should be above the zero level, but tends to decrease.
The strategy using divergence is built on the divergence of price and indicators Bulls Power and Bears Power, although it is a rare signal, but the more informative it is. In a bullish divergence the indicators on the Bears Power oscillator are placed below the zero mark, but are growing, while the price continues to decrease. A divergence indicates an uptrend can be expected. In a bearish divergence, the Bulls Power indicator readings are above the zero level, but are declining while the price is rising. The divergence shows that we can expect a trend reversal to a downtrend soon.
Despite the fact that it is not recommended to implement strategies only with the considered oscillators without additional indicators, there is a trading strategy, which uses only Bears Power and Bulls Power. For example, if the Bulls Power indicators in the histogram begin to decrease and the Bears Power bars increase, it can be a signal to sell. If the Bulls Power figures increase and the Bears Power figures decrease, it can be a signal to buy. But more often in strategies with the Bears Power and Bulls Power oscillators are used indicators Stochastic, RSI, MACD, ATR, Bollinger Bands.
Bears Power and Bulls Power oscillators are also used with Bill Williams indicators, in particular, in the Accelerator Oscillator strategy. In this strategy, the Elder indicators are used as the main ones, and the Accelerator Oscillator is used as a signal filter (Figure 4):
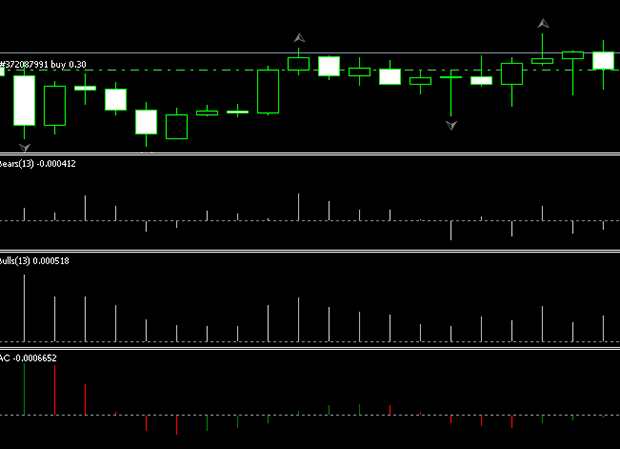
Image. 4
This strategy is applied on timeframe from M30, all indicators are set with standard values. Sell positions are set when the Bulls Power indicators are above zero and tend to weaken, cross the zero level below zero, and the Accelerator indicator is colored red, placed below zero or equal to zero.
Buy positions are established when the Bears Power is placed below the zero mark, you should wait when its indicators cross the line to the mark above zero, the Accelerator indicator should be colored green and placed above or on the zero mark.
In the other strategy together with Bulls Power and Bears Power indicators are used Momentum and Elder Impulse System with standard settings. Recall that Momentum is a trend indicator, which is included in the list of standard tools of trading terminals, it measures the magnitude of price change over a certain period of time.
The Elder Impulse System is basically a trading system consisting of EMA and MACD: the EMA is used to determine the trend and the MACD shows the momentum. This indicator can be downloaded for example here https://www.mql5.com/ru/code/21866.
Buy positions are opened when Momentum crosses the 100 level from below, the Elder Impulse System indicator is colored green, and the Bulls Power oscillator indicators are not only above the zero level, but also continue to grow. The opening of a sell position implies a downward crossover of the Momentum 100 indicator level, the Elder Impulse System should turn red, the Bears Power indicators are placed below the zero level and continue to fall:
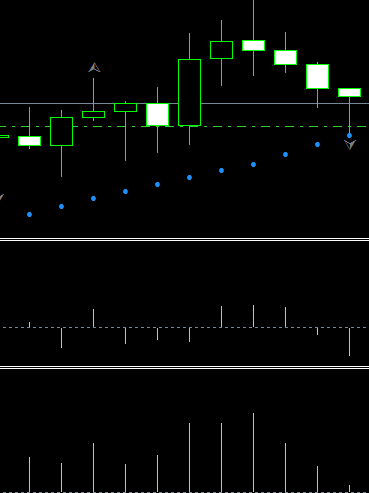
Image. 5
Another fairly popular strategy, which, for example, with Bears Power applies Parabolic SAR (Fig. 5). In this case the signals are generated by Parabolic, the points of which are placed on any side candles on the chart: if the point is above the candle, it is a sell signal, if the point is below the candle, it is a buy signal. Bears Power confirms the Parabolic signal under a candlestick.
Conclusions
Bulls Power and Bears Power oscillators have such advantages as a fairly realistic display of the market situation, ease of use and interpretation of signals, the ability to predict future developments, versatility.
In general, these are quite effective indicators for trading. Their main disadvantage is that it is not recommended to use these indicators without other market instruments. If used together, Bulls Power and Bears Power can be the basis of many effective strategies.
Reviews
-
16 August 2019 in 15:11
Dobrechko!
Actually these bulls and bears turn is not quite clear their reflection on the chart. If you understand them correctly, if there is a bearish trend, then the bearish oscillator shows downwards, then the bulls should be smaller. Nevertheless I noticed that when bearish trend is 100% and oscillator shows downwards, anyway bullish trend wins. How can it be? That is, the bearish trend has not moved.