Oscillators for Forex
Oscillators are an alternative and/or supplement to the forex indicators on the trading chart. Oscillators are considered leading indicators.
Contents
What are “forex oscillators” and what are they for?
Often oscillators are not distinguished in a separate group of tools and call them indicators. However, oscillators are still different from indicators. From the point of view of technical analysis, oscillator is an expression of price movement for a period of time. In the trading terminal, oscillator is most often placed in the form of a line chart at the bottom of the main chart.
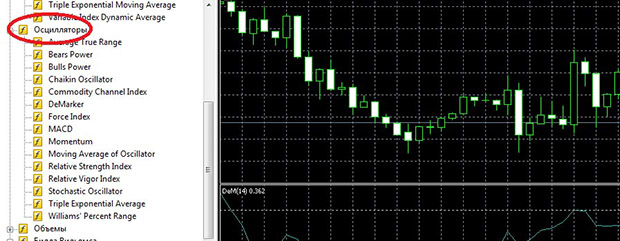
The oscillator should help the trader to show quickly and accurately the state of the market, in particular, to determine whether the market is overbought or oversold. On different trading platforms for forex trading The same oscillators are presented, in general, as the most popular and time-tested ones. On MetaTrader4 oscillators are located on the left side of the chart in a special list.
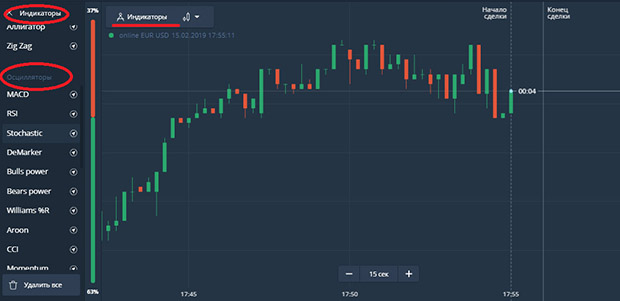
Similarly located oscillators on the Olymp Trade (site) in the “Indicators” section:
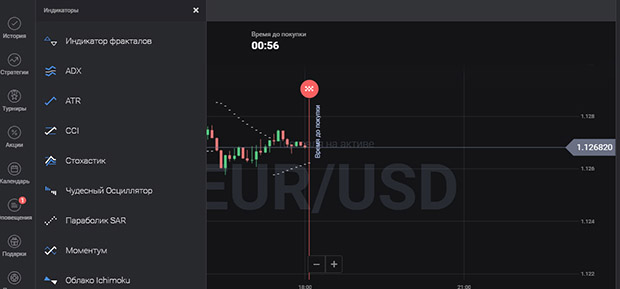
Most other trading platforms use the functionality of MetaTrader4. On a platform for binary options Binomo (bonus 100% to deposit by promo code REVIEWEEK100 – Activate) there is also a standard set of oscillators, they are not highlighted in a separate list, they are in the indicators section.
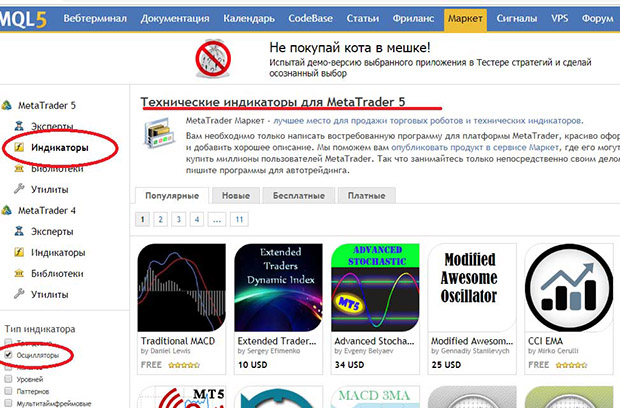
On the MetaTrader platforms (4 and 5), in addition to the standard oscillators, you can also download authors’ oscillators in the Market section by specifying the desired search option.
Using oscillators
It is assumed that oscillators can predict the direction of a trend change before it is seen on the chart. The main thing that oscillators show and on the basis of which you can make market predictions is the overbought and oversold nature of the forex market (The whole truth about forex).
Overbought is when the price reaches such a level, after which further price increase is doubtful. Oversold is characterized by such a low price of the asset that further price decrease is unlikely. Overbought or oversold condition indicates that trend will soon change. The task of the oscillator is to show overbought and oversold areas before the trend starts to change direction.
Oscillators are also used to detect divergences – the divergence of oscillator and price, and convergences – the convergence of oscillator and price, which also indicate a change in trend.
Most traders believe oscillators are useless in a pronounced trend and effective in a flat, in this case, using oscillators, you can quickly notice the short-term oversold or overbought. But there is another opinion: oscillators can detect overbought and oversold conditions in a clearly defined trend and they can help you see when the trend is losing its strength.
In any case, oscillators are most often used as a supplement to indicators, not as a full-fledged trading tool. Indicators of oscillators are most accurate in a number of cases, these include, in particular, the extremes that the oscillator reaches. This means that the trend is weakening and there may soon be a reversal. Another situation requiring attention is when the oscillator crosses the zero line and this coincides with the trend direction.
Top 3 Best Forex Brokers: Test the oscillators in their terminals
| Broker | Bonuses | Open an account |
|---|---|---|
|
1
|
50 %
Bonus on deposit from $100 USD – promo code WELCOME50
|
Start |
|
2
|
From 25 To 60 %
Deposit increase for the first deposit
|
Start |
|
3
|
Cashback
Refunds of commissions, spreads and other costs
|
Start |
|
4
|
100 USD
Loyalty program remuneration
|
Start |
|
5
|
20 %
Bonus and cashback by promo code revieweek23
|
Start |
Classic Oscillators in MetaTrader5
Let’s consider several indicators that are pre-installed in the MetaTrader5 trading terminal.
Average True Range or Average True Range Indicator (ATR). The oscillator was invented by J. Welles Wilder, a well-known trading practitioner and theorist. Welles Wilder. Oscillator shows the market volatility and can be used as a trend filter, it is also considered the most effective in determining the points of setting stop-losses.
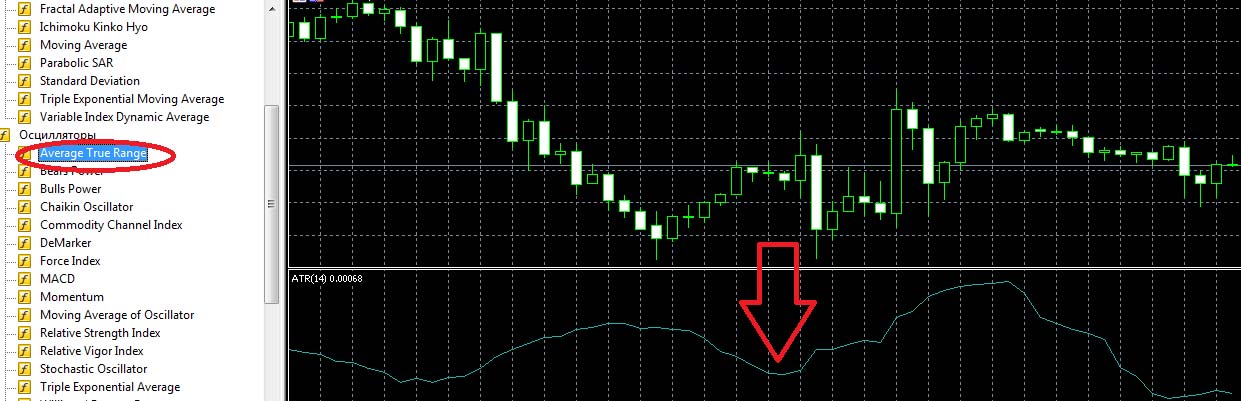
The “True Range” itself (True Range) is the greatest product of three values: the difference between the closing price of the previous period and the present minimum; the difference between the closing price of the previous period and the present maximum; the difference between the present maximum and the present minimum. The ATR oscillator is nothing more than moving average values of the true range.
The oscillator principle is based on the fact that the higher the value of the oscillator, the greater the probability of trend change, respectively, the lower – the weaker the trend, the prevailing flat movement. In order to apply ATR as a trend filter, it is necessary to set some midline on the chart – it is determined “by eye” for each case. Strong trend movements are defined as a breakdown of this average line. The efficiency of the indicator makes it popular for the development of Expert Advisors and automatic trading systems, aimed at determining the volatility.
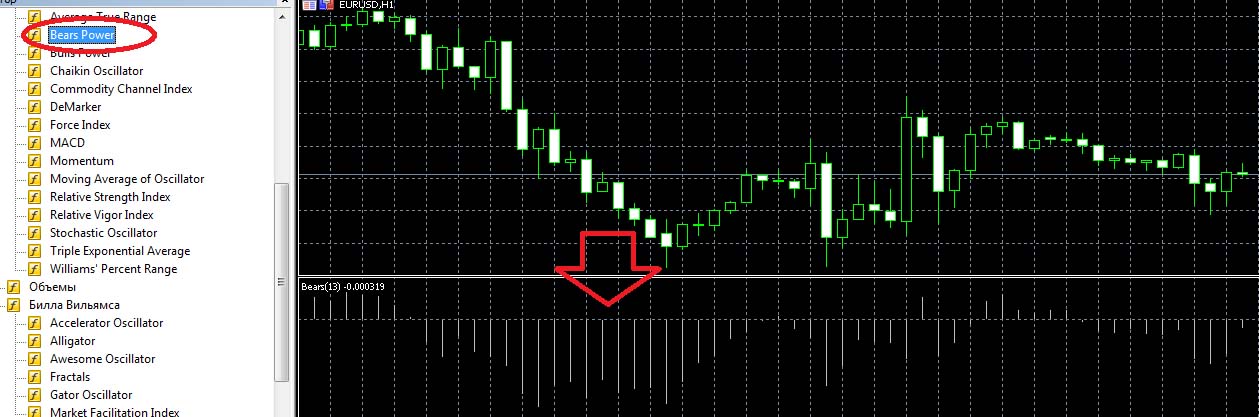
The task of determining the balance of sellers (bears) or buyers (bulls) in the forex market is solved by using indicators Bears Power and Bulls Power. Bears Power is the difference between the minimum price value for the day and the exponential moving average with a period of 13. On the chart, the oscillator looks like a histogram with a zero level. If the oscillator is below zero, the market is dominated by bears. If it is above zero, the initiative is taken by the bulls.
Another oscillator – Bulls Power – informs about the strength of the bulls. It represents the difference between the maximum price value and exponential moving average with a period of 13. It looks like a histogram with zero level on the chart. If the values of the oscillator are above zero – the domination of bulls is confirmed, if below zero, the trend can change in the opposite mood.
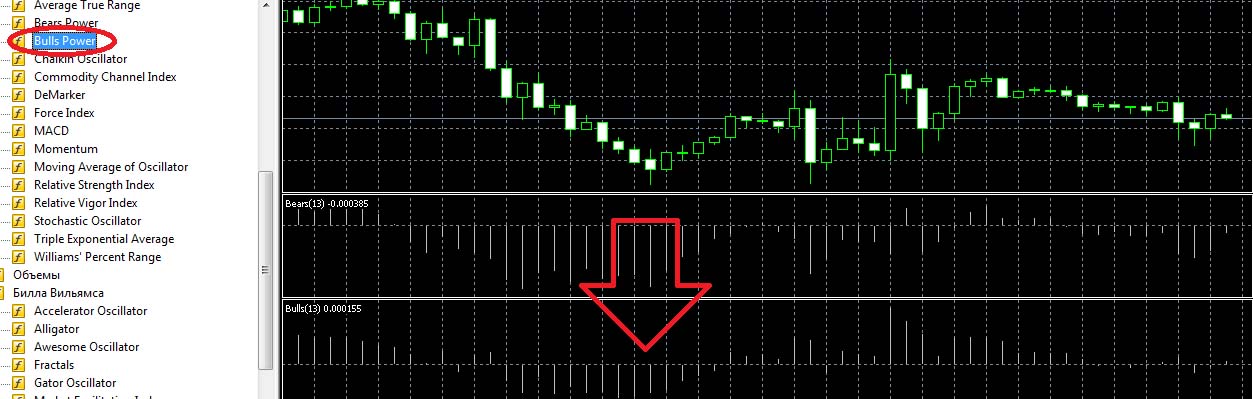
Bears Power and Bulls Power oscillators are recommended for use with trend indicators, it will allow more accurately identify market trends, for example, if the indicator shows an uptrend and the index of bears below zero, then you should wait for a change in the trend and you can open a position to buy. Conversely, if the trend indicator shows a downward trend and the Bulls Power index is above zero, we can assume a rapid change in the oscillator indicators and prepare positions for sale.
Chaikin Oscillator (Chaikin oscillator) predicts the behavior of the accumulation/distribution line, which can predict the trend change. The values of Chaikin’s oscillator are calculated as the difference between the exponential moving average for 3 days and for 10 days. The positive value of the oscillator shows that the bulls (buyers) are increasing pressure on the market, and a negative value, respectively, shows that the bears are activated in the market.
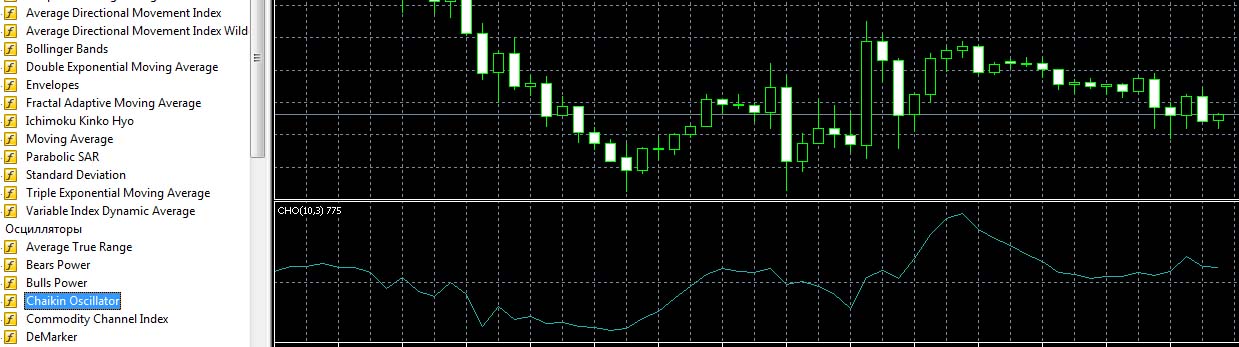
The indicator also shows the divergence, which allows giving more accurate trend forecasts. For example, when the Chaikin’s oscillator shows a minimum above the previous one in a downtrend, we can assume a bullish divergence, and the bears are losing positions.
The oscillator is considered quite accurate, but too sensitive, so the signal to open positions – the oscillator crosses the zero line, occurs too often. Therefore, it is used in conjunction with indicators that allow you to filter the signals (eg, RSI, CCI, Stochastic and so on).
Commodity Channel Index is a multifunction oscillator (Commodity Channel Index, CCI). It is mainly designed to determine overbought and oversold, over- or underpriced to the statistical average.
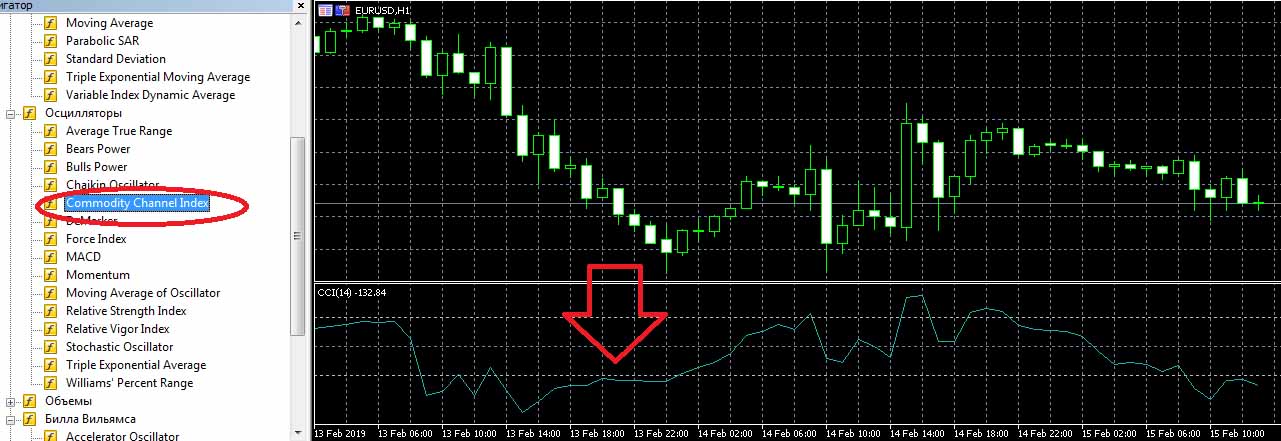
The oscillator has a scale, on which the values from +100% to -100% are indicated, which show under- or over-sold or over-bought price values and over-bought zones respectively. High or low values of the oscillator indicate a possible correction or change of trend. In addition, the oscillator helps to identify good entry or exit points when crossing the zero line and shows divergences. But the CCI is quite difficult to master.
Demark Oscillator, DeMarker or Demark indicator, was invented by trader and analyst Thomas R. Demark in order to estimate overbought and oversold conditions as accurately as possible. He did it quite well, and the oscillator is considered to be effective. In addition to estimating oversold and oversold conditions, DeMarker allows you to determine divergences, the approach of a trend reversal.
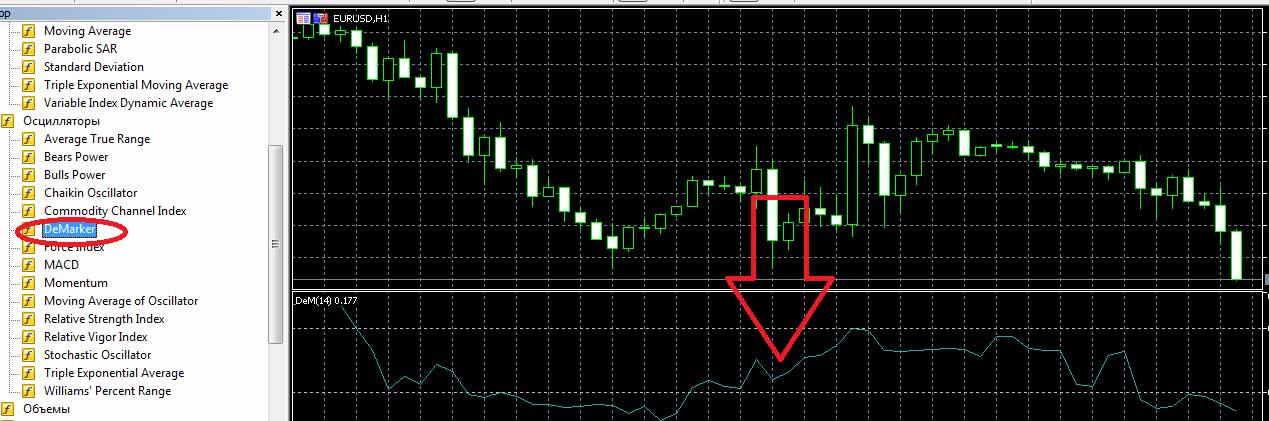
For example, if prices make a high above the previous high and the DeMarker shows a high below the previous high, it is likely that the uptrend is changing into a downtrend. Such a position of the oscillator is called a “bullish divergence”. “A bearish divergence, respectively, indicates a possible change from a downtrend to an uptrend, when the price minimum is fixed below the previous one, and the DeMarker shows a minimum above the previous one.
Force Index or Force Index (FRC) is an oscillator for determining the strength of bulls and bears on a downtrend or uptrend.
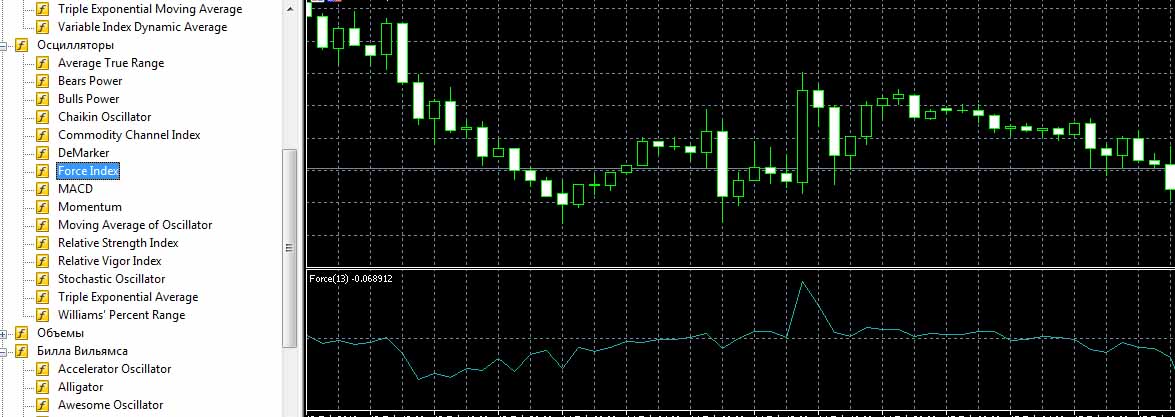
The Power Index is composed of such indicators as the direction of price movement, the size of the price movement and trading volume. First of all, the current price and the previous closing price are compared. Taken together, the three values make it possible to determine how strong the bulls are on the rise in price or how strong the bears are on the fall in price. If the current price closes above the previous one, it means that the strength is positive and the bulls dominate. If the current price is lower than the previous one, the bears are dominating and the force is negative. Trading volume confirms this or that force trend.
The listed oscillators are among the most popular, as well as MACD, Momentum, Moving Average of Oscillator, Relative Strength Index, Relative Vigor Index, Stohastic, Gator Oscillator, Zigzag, Murray levels, Average Daily Range, Williams Percent Range, McClellan oscillator, Triple Exponential Average, Awesome Oscillator, Arms indicators, On Balance Volume indicator, Aroon, Accelerator Oscillator, Linear Regression Indicator, Average Directional Movement Index, Ease of Movement Value, Mass Index and a number of others.
Advantages and disadvantages of oscillators
Oscillators differ in effectiveness, preferred application situations, complexity and other features that you should study before using them in trading.
But oscillators have both general disadvantages and advantages. The advantages include, for example, the fact that they give anticipatory signals about the end of a trend or correction. Most oscillators are easy to understand and easy to tune to a trader’s requirements. On the other hand, as a disadvantage – these signals can be false, and oscillators can, for example, signal a trend reversal already when a stable trend is formed.
For this reason, oscillators are not used without indicators and their use is limited to a trading range equal to the length of the oscillator, then it must be reconfigured.