Williams Percent Range (%R) Indicator
Contents
Description of the Williams Percent Range Indicator
The Williams Percent Range (%R, Figure 1) was developed by the prominent trading theorist and practitioner Larry Williams (not to be confused with Bill Williams) in 1973. The indicator shows the oversold/oversold level of the market by the position of the current closing price in the range between extrema of the past period.
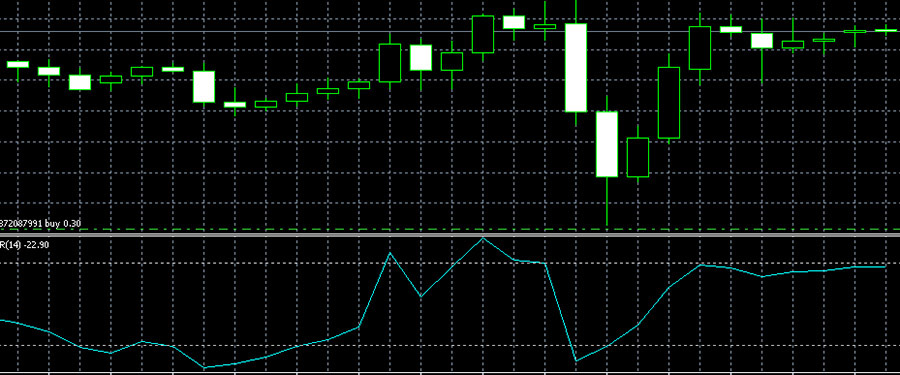
Image. 1
The price level allows you to determine the predominance of buyers, “bulls”, or sellers, “bears”. The maximum value reflects the strength of the “bulls”, the minimum extremum – the strength of the “bears”, by the closing price you can see which group of traders prevails in the forex market (The whole truth about forex).
Log into your broker’s terminal, add the Williams Percent Range indicator to the chart and see what comes out
| Broker | Bonuses | Open an account |
|---|---|---|
|
1
|
50 %
Bonus on deposit from $100 USD – promo code WELCOME50
|
Start |
|
2
|
From 25 To 60 %
Deposit increase for the first deposit
|
Start |
|
3
|
Cashback
Refunds of commissions, spreads and other costs
|
Start |
|
4
|
100 USD
Loyalty program remuneration
|
Start |
|
5
|
20 %
Bonus and cashback by promo code revieweek23
|
Start |
Calculation formula
The Williams Percent Range is calculated using the formula:
%R = -(MAX (HIGH (i – n)) – CLOSE (i)) / (MAX (HIGH (i – n)) – MIN (LOW (i – n))) * 100, where:
- CLOSE (i) – the current closing price;
- MAX (HIGH (i – n)) – the maximum for the previous periods (n);
- MIN (LOW (i – n)) – the minimum for the previous periods (n).
In the terminals, the standard indicator period for extrema is 14. The indicator values are placed in the range from 0 to -100. It is believed that %R works more accurately on a weak trend and flat and less effectively on a strong trend.
The Williams Percent Range Indicator is similar to other similar instruments, but does not have any common modifications. It has the greatest similarity with the oscillator Stochastic.
The Williams Percent Range indicator in the MetaTrader 5 platform
Williams Percent Range is one of the standard indicators in the trading terminals. On the MT5 platform it can be found in the “Oscillators” subsection of the “Insert” section (fig. 2):
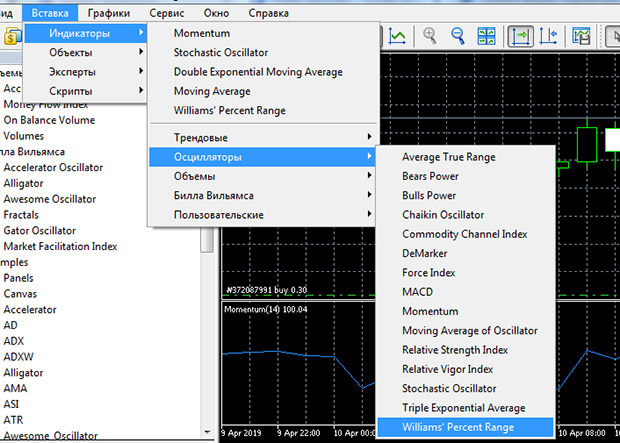
Image. 2
In the settings here is a standard period of 114, it can be changed for any strategy, as well as values of percentages from -20 to -80 are set (Fig. 3):
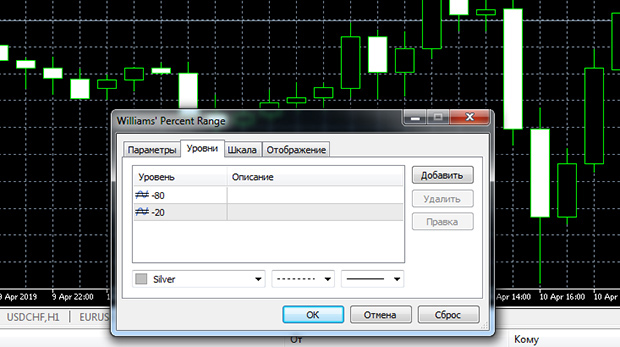
Image. 3
Williams Percent Range Indicator Signals
The %R indicator compares the closing price to the last range. If the closing prices are close to the maximum, the indicator shows values close to zero. If the closing prices are close to the minimum, the indicator shows values close to “-100”.
The Williams Percent Range shows that when it rises above 20 it indicates that the price is approaching the highs and this can be interpreted as a signal to sell. Oversold this forex indicator shows when the value is below 80, it indicates that the price is approaching the lows and can be regarded as a signal to buy. The signal for the indicator to exit oversold or overbought zones is when it crosses the -50 level, which should preferably be confirmed by additional oscillators for forex.
The Williams Percent Range sometimes shows a divergence, which is a significant signal, so you should pay special attention to it. If the price maximum is updated and %R shows a lower maximum than the previous one, this is a signal to sell. If the indicator shows a higher minimum than the previous one, and the price has updated the minimum, it is a signal to buy.
The difficulty in interpreting Percent Range signals is that once it enters an overbought/oversold zone it can stay in those zones longer than the price is trending. This leads to the fact that it is problematic to work against the trend with %R because of the large number of false signals.
The Williams Percent Range signals are more accurate during trend or flat trading. In particular, it is applicable to the following strategies forex trading trend, when large calculation periods are used and the -45 and -55 levels are used as signal levels. But in any case Williams Percent Range signals are not unreasonable to clarify with the help of additional tools.
Trading strategies based on the %R indicator
The %R indicator is a fairly simple tool, but its indicators are enough to create a full-fledged forex strategy. A strategy that uses two %Rs at once, one of which determines the trend direction and the other shows entry signals, is considered more effective.
For example, some traders use a strategy in which one of the indicators is set with a period of 14, the other with a period of 28 (Fig. 4). An indicator with a longer period signals an uptrend if it is above -55. A descending trend is indicated by a mark below -45. The trade signal opens when %R with a period of 14 closes above %R with a period of 28.
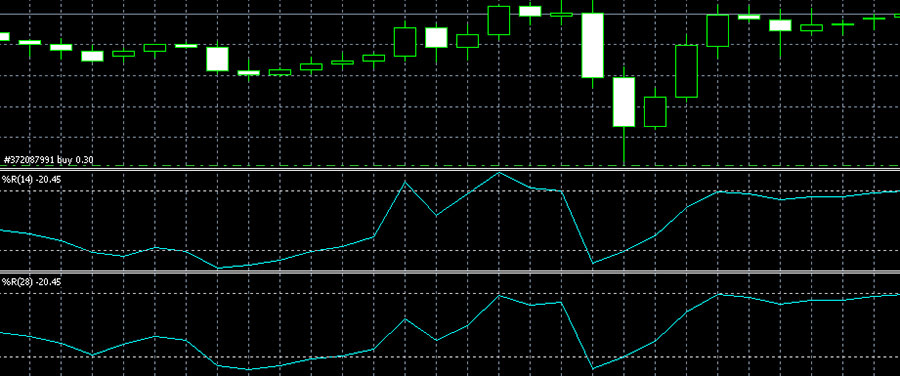
Image. 4
The “Williams Percent Range” indicator is used in the strategy with the lines support and resistancewhich are determined by the last minima and maxima of the price. On %R a standard period of 14 is set. %R should show an exit from overbought, in this case the signal to sell will be a rebound from the resistance line.
Williams Percent Range is often used in simple, effective strategies, such as with the SMA (Fig. 5). This strategy is preferably implemented on the H1 timeframe. Moving Average is set to the MA method – Smoothed and for a period of 25, Williams’ Percent Range – for a period of 200. The task of %R is to accurately determine the beginning of a trend or reversal, and the MA shows signals to enter the trade. Signal to buy – %R exits oversold and crosses -80 from bottom to top, with the bar closing above the MA. Signal to sell – %R exits the overbought zone with a cross of -20 from above downwards when the bar opens below the MA.
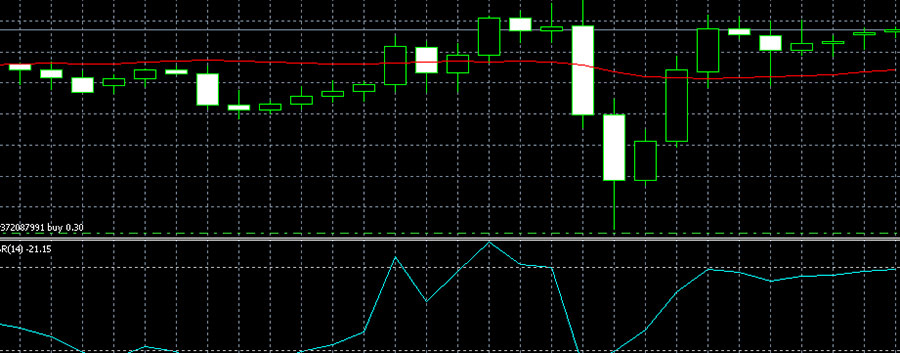
Image. 5
The Williams Percent Range is used in conjunction with the exponential moving average, preferably on the H4 timeframe. If the price is lower than EMAand the %R indicator goes down from -20 to -80, this could be a signal to sell, if the Percent Range goes from -100 to -80, this could be a signal to buy.
The other strategy uses Stochastic and Williams PR and may also use resistance and support lines, preferably on the M15 interval. The signal to sell is when the resistance level is touched and %R should be overbought, as well as Stochastic.
The strategy with 4 indicators (Fig. 6) uses, besides Williams Percent Range, a simple moving average SMA with a period of 50, SMA with a period of 200 and the MACD. The strategy works better in a volatile market.
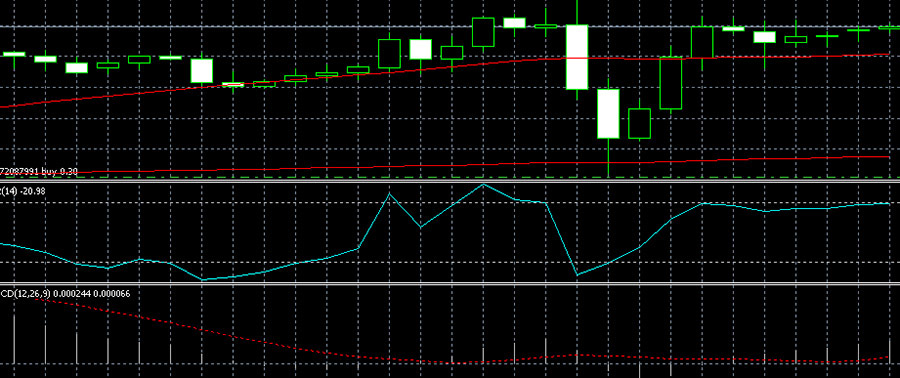
Image. 6
The signal for a trade is when both SMAs are directed upward, the MACD should be below zero, and the Williams%R indicator is at or below -80.
The MACD may be the only additional indicator for the Williams Percent Range. The MACD with parameters 24, 36, 14 and the Williams Percent Range with a period of 28 can be a variant of application. The strategy is recommended for implementation on a 1H to 4H timeframe. The Williams %R indicator is the main indicator in this strategy, its indicators should be confirmed by the MACD. For example, if the Percent Range indicators are higher than -20, a trade is opened in anticipation of a price increase, if it is lower than -80, a price decrease is assumed.
One of the common strategies uses, in addition to the Williams Percent Range, indicators RSI and Stochastic. RSI is set to period 21, Stochastic has parameters 30, 8 and 18. Williams Percent Range settings are standard.
In addition, it is proposed to prepare three charts with different timeframes and indicators. This is necessary in order to confirm Forex signals of the chart with the timeframe H4 with the signals of the H1 and M15 charts. If the signals coincide on all charts, this market information is accurate with high probability. When an uptrend is forming, RSI is placed above the 50 level, Stochastic confirms this information, Williams% R is placed near -80. A downtrend is indicated by the fact that the RSI is placed below the 50 level, the Stochastic confirms the sellers advantage, and the Percent Range is placed near -20.
Williams Percent Range is also used for scalping strategies. The indicator is set with the standard parameters, the strategy uses Fibonacci Levels. When the price of an asset rises and reaches the Fibonacci level from 23.6% to 38.2% and Williams’ Percent Range is below the -80 level, this is a buy signal. Sell trades are opened when the price falls, reaches the Fibonacci level from 23.6% to 38.2% and %R is placed above -20, this is a signal to sell.
Four indicators, except Williams Percent Range, are Moving Average, CCI Average Trading Channel Index and ATR True Range Average Indicator used in the following strategy. The MA is set with a period of 90, the CCI Average is set with a period of 12, the ATR has a period of 14, the Williams Percent Range has a period of 11.
If the price was above the Moving Average indicator line, Williams Percent Range indicator – below -85, ATR indicator – above the value of 0.002, CCI Average – below the value of -100 – this is a signal to buy. A signal with the opposite value – if the price is below the MA line, the Williams Average Percent Range Indicator – above the value of -15, the Average True Range Indicator – above the value of 0.002, and the Trading Channel Indicator – above 100. The strategy is implemented on timeframes up to 5 minutes.
The Williams Percent Range is often used in simple strategies, but also as part of strategies with a large number of indicators. For example, on the hourly timeframe as part of a system of seven indicators: Pivot to display resistance and support levels, Envelopes to determine the range of price fluctuations, SHI_SilverTrendSig indicator to identify expected trend reversal points, Stochastic oscillator (with parameters 14,8,13 for H1 timeframe), Money Flow Index (with period of 21) to determine the rate of price change, RSI oscillator and Williams Percent Range (with period of 35).
Buy is when Envelopes touches support, SHI_SilverTrendSig blue point is visible, Stochastic shows 20 with crossing from below, RSI crosses 30 level from below, MFI and %R show oversold. The signal to sell is a combination of factors when Envelopes touches resistance, the red SHI_SilverTrendSig point is visible, Stochastic crosses 80 from above, RSI crosses the 70 line, MFI and %R show overbought condition.
Conclusions
The Williams Percent Range is a simple and popular indicator from the list of tools created by Larry Williams. Its main advantages include the fact that it can produce strongly anticipating signals. This allows using it in many strategies. The disadvantages of the indicator include the fact that it reacts very quickly to the slightest price changes, which can lead to a large number of false signals.