Linear Regression Indicator (LRI)
Contents
Description of the Linear Regression Indicator
Linear Regression Indicator (LRI) was developed by trader Gilbert Raff in 1991 in order to predict prices as early as possible. The indicator is based on the mathematical concept of regression. Simplified, its essence is that if there is a certain amount of data, having one source and scattered relative to each other, it is possible to determine the relationship and direction between them.
Regression and its indicator
To build a regression on a two-dimensional graph, the method of least squares is used – they take the values of the data for the period and calculate the average line. Price movements are also described by a two-dimensional graph and the regression is built similarly – the average of the data (price values) is calculated, in the form of a line, and by the way the line is sloped, it becomes clear which price trend prevails.
The indicator is constructed as two parallel lines equidistant from the center line, drawn in such a way that they cover all price values. Thus, a channel is formed, the price values in which move at the resistance and support lines formed by the borders of the channel. In general, it gives an adequate picture of the market situation and allows to build practical trading strategies.
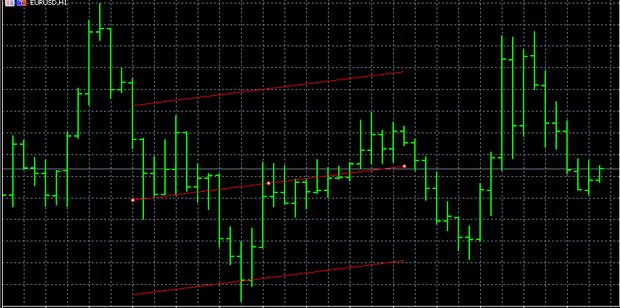
On the price chart, the LRI is represented as three lines: the trend line; the support line, which is placed above the price, at a distance of the maximum deviation of the price from the center line; the resistance line, corresponding to the maximum deviation of the price from the center line.
It is empirically proven that the price of the asset is mainly within this “corridor”, on the other hand, a break in this range against the trend or long enough placing the price outside the channel shows a change in the trend.
The linear regression channel indicator can be used on any asset and on any timeframe, and is most often used to mark the upper and lower limits of the market.
Indicator in the terminal
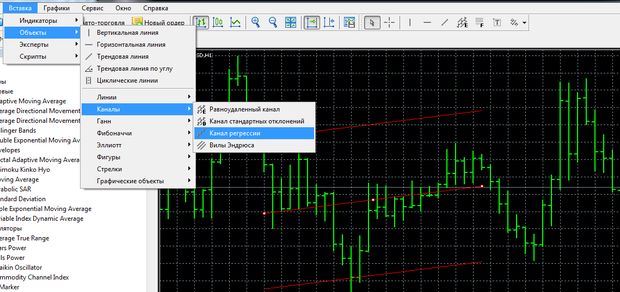
The linear regression indicator is standard for trading terminals (forex indicator). In MT5 it is located in the “Insert” section, “Objects” subsection among other “Channels”.
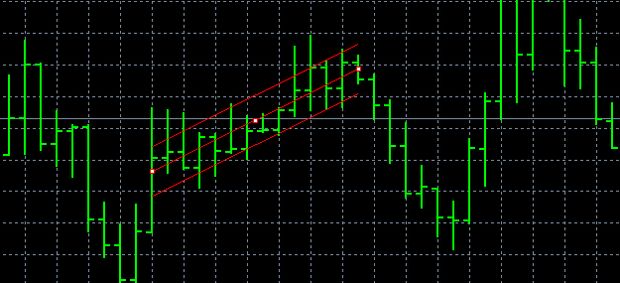
The indicator is set up by the trader to implement a specific strategy. The trader determines two points, and the indicator builds channels based on all price values that are between these two points.
If you want to change the counting interval, double-click on the center line of the channel and click the left mouse button to move the desired point.
In the “Parameters” tab, you can change some coordinates by changing the time interval of the channel construction, or change the type of indicator lines, or mark the period of the channel display on the chart.
You can also change minor properties of the indicator by clicking on it with the mouse and calling the standard menu.
In order to use an indicator with more complex settings, in a colorized version, you need to download it from a third-party source. For example, for MT4 you can find it at https://www.mql5.com/ru/market/product/6106.
To place an additional indicator on the chart, you need to download it to the MT4 folder on your computer. Then in the terminal go to “File”, go to “Open data directory” and double-click on the download file. Now the indicator is in the list of custom indicators.
Log in to your broker’s terminal, add the LRI indicator to the chart and see what comes out
| Broker | Bonuses | Open an account |
|---|---|---|
|
1
|
50 %
Bonus on deposit from $100 USD – promo code WELCOME50
|
Start |
|
2
|
From 25 To 60 %
Deposit increase for the first deposit
|
Start |
|
3
|
Cashback
Refunds of commissions, spreads and other costs
|
Start |
|
4
|
100 USD
Loyalty program remuneration
|
Start |
|
5
|
20 %
Bonus and cashback by promo code revieweek23
|
Start |
LRI applications and signals
Traders track the price movement within the corridor constructed by the indicator. The longer the channel, the stronger it is. Going outside the channel, most likely, heralds a change in the trend. Then trades are either inside the channel or on a breakout.
As for the signals, the trader should pay attention to the price indicators relative to the three channel lines. If prices are placed above the middle line, then the market is dominated by bulls. If prices are below the middle line, then bears dominate the market.
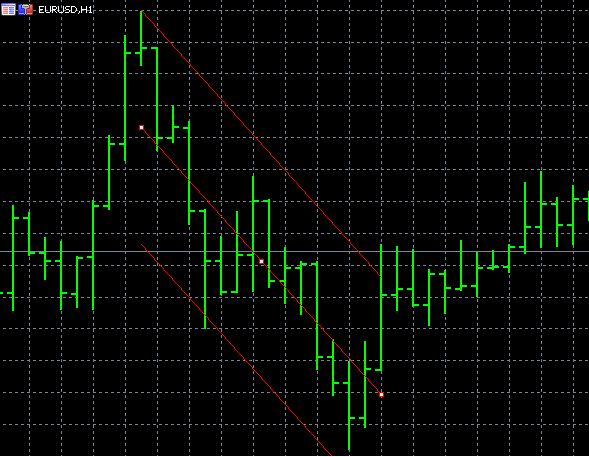
The further direction of the trend shows the direction of the center line of the channel. If the line rises, it indicates an uptrend, if the center line falls, a downtrend is formed.
The price movement along the trend from one corridor boundary to the other shows momentum. If price bounces off the channel boundary against the trend, it is a pullback, and if it reaches another boundary, the trend is restored.
Particular attention should be paid to situations when the price approaches the boundaries of the indicator channel. If the price breaks away from the resistance or support line, you should expect the trend to continue.
Strategies with a linear regression indicator
The two main strategies work with the indicator of linear aggression are obvious and based on the LRI signals. As the price approaches the upper border of the channel, you can get ready to open a sell position. When the price approaches the lower border of the channel, you can prepare to open a buy position.
A fairly popular version of the strategy is to use two regression channels at the same time, but with different parameters. Then a strong signal will be the mutual positioning of support and resistance lines, that is, the boundaries of the indicator corridors.
There is a strategy in which trading is carried out on the corners of the linear regression channel lines. The strategy is implemented on the hourly timeframe. In this strategy, it is important to determine the reference point from which the channel will be built. The last week preceding the trading is taken as the basis.
A regression channel is built on the prices of the past week and the direction of the trend is determined by its slope. The basic rule for this strategy is to buy when the trend is up and sell when the trend is down. Orders are rearranged according to the trend, as the regression boundaries continue on each new value of the bar. Trades are closed at the close of the week, in addition, all trades are closed if the regression channel has a slope of less than 15 degrees.
However, the linear regression indicator by itself does not provide points of entry into trading, including not enough for a full-fledged effective strategy using two LRI. But the indicator can be the basis of strategies using other indicators and oscillators.
In particular, the use of a linear regression indicator with Stochastic or Fibonacci lines is considered effective.
Most strategies with LRI involve identifying a leading trend and trade in the trend after a pullback, which requires indicators to confirm the signals.
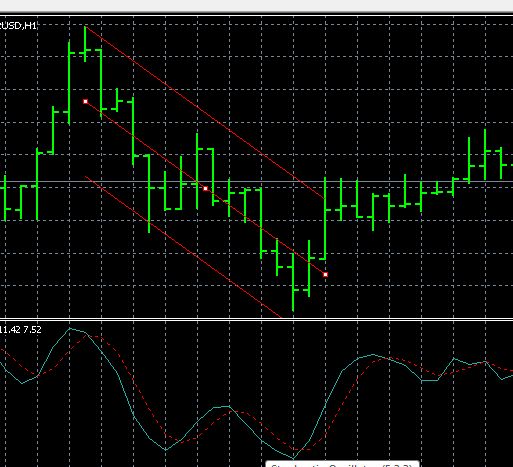
In the LRI strategy with Stochastic (5,3,3) Sell positions are opened when the regression channel is directed downward, and the moment when the price crosses the trend line of the indicator or when the indicator approaches the lower border of the channel is monitored. Stochastic at this time comes out of the oversold area above the level of 20, shows the “rising cross” pattern, and the main line crosses the signal line from bottom to top.
Sell positions are opened when the regression channel is directed upward, prices are above the trend line or already approaching the upper limit of the linear regression indicator channel. Stochastic exits the overbought zone, shows the pattern “descending cross” and the main line crosses the signal line from top to bottom.
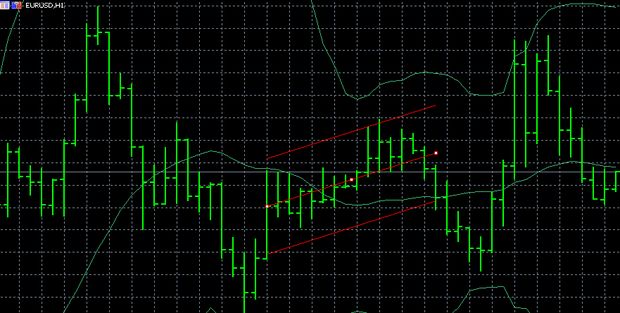
Another trading strategy involves the use of Bollinger Bands. In this strategy, the main signal will be placing the price at the bottom Bollinger Band and at the same time on the lower border of the regression channel, it is a signal to buy. The signal to sell will be placing the price at the upper limits of the Bollinger Band and Linear Regression Indicator.
LRI is used in the strategy with the support of Xaser FV and RSI indicators. The Xaser FV indicator determines the presence of a trend in the market by volatility, cutting off flat movements. RSI is one of the most popular oscillators at forex trading, Relative Strength Index, which determines the strength of the trend and the possibility of reversal.
The strategy is implemented on timeframe H4, on any currency pair. The Linear Regression indicator is set in the colored version with the settings period = 40, the calculation period of the flat = 0. RSI indicator is set with a period of 14; prices at closing; levels are 30, 70, 50.
The conditions for buying are as follows: Linear Regression was red long enough, but on a certain bar it turned green. At the same time Xaser FV for some time was placed at zero level, and then shows an uptrend for at least 3 bars, being placed above zero level. This should be a trending movement, not a correction. The RSI should be placed above at least level 50 (Forex Trading Training).
Opposite conditions for a sell position: Linear Regression was green, but on a certain bar it turned red. At the same time, the Xaser FV was for some time placed at the zero level, and then shows a downtrend for at least 3 bars, being placed below the zero level. Stronger signals are considered when the RSI is placed at levels 30 and 70, respectively, the direction of the trend, but in this case the number of signals decreases.
Conclusions
Linear Regression Indicator (LRI) allows confidence in predicting the price dynamics, and its signals are simple and clear, even for novice traders.
The linear regression indicator is preinstalled in the main trading terminals, and the principle of constructing the indicator channel is objective, built on a clear mathematical formula and therefore does not depend on the trader, and thus avoids errors of subjective perception. LRI signals are reliable and accurate, and if used correctly, they can become a key part of the strategy.
The disadvantages of the indicator of linear regression include the fact that it re-draws values after the closed bar, taking the indicators LRI as a certain average value can make a mistake, and this often happens, so you need to understand what exactly shows this indicator and what it is for.
The linear regression channel indicator redraws its values after each closed bar. This is quite natural and follows from the logic of work, but for some traders it can be a serious disadvantage. You should understand well how and what this tool is used for and not try to take the regression as an ordinary average.
Also characteristic for a linear regression indicator is a lag of signals, however, this is a problem of most indicators and oscillators.