Aroon Indicator
Contents
Description of the Arun indicator
The Aroon indicator was created in 1995 by Tushar Chande, head of Tuscarora Capital Management, who is also famous for combining two indicators – Stochastic and RSI in one tool, as well as creating the RAVI indicator. Aroon was supposed to act as an indicator that gives the earliest signals to open positions.
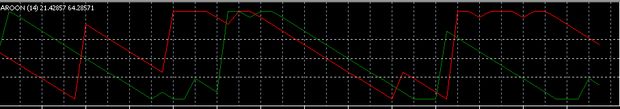
Image 1
According to the author’s idea, his indicator should generate early trading signals, so he named it “aroon”, which in Sanskrit means “early light of dawn”. In practical trading, Arun is used to determine the strength and direction of the trend and the situation of a trend transition into a flat and vice versa.
Arun is a small system consisting of 2 lines and oscillatorswhich shows the interaction of the lines. There are two lines: upper Arun (Aroon(up), fig.2) and lower Arun (Aroon(down), fig.3). The oscillator ranges from 0 to 100.
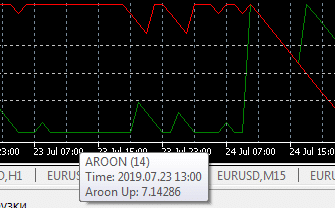
Image 2
The Aroon Up indicator line shows how many periods have passed since the formation of the local maximum, the Aroon Down line shows the number of periods that have passed since the local minimum.
The peculiarity is that only extrema that fall within a certain period are taken into account, the indicator builds an indicator based on the data of the last price bars. By default, this period is 14.
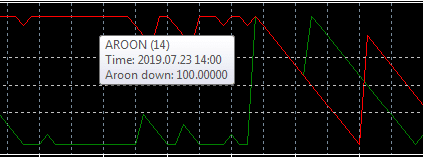
Image 3
Log in to your broker’s terminal, add the Aroon indicator to the chart and see what happens
| Broker | Bonuses | Open an account |
|---|---|---|
|
1
|
50 %
Bonus on deposit from $100 USD – promo code WELCOME50
|
Start |
|
2
|
From 25 To 60 %
Deposit increase for the first deposit
|
Start |
|
3
|
Cashback
Refunds of commissions, spreads and other costs
|
Start |
|
4
|
100 USD
Loyalty program remuneration
|
Start |
|
5
|
20 %
Bonus and cashback by promo code revieweek23
|
Start |
Applications and signals of the Arun indicator
The Arun indicator was created for stock and commodity markets. In forex trading, the main signal is the intersection of lines. For example, crossing the line Aroon up line Aroon down from bottom to top indicates the emergence of a medium-term uptrend and the possibility of opening a buy position. If the Aroon up line crosses the Aroon down line from top to bottom, it is a signal to exit the buy (forex trading).
On the contrary, the crossing by the line Aroon down of the line Aroon up from the top down indicates the emergence and possible development of a downtrend and the possibility of opening a sell position. The exit from the position will be the crossing by the line Aroon down of the line Aroon up from the bottom up (Forex Trading Training).
The author of the indicator suggested considering the following signals: an oscillator indicator above 50 shows a strong uptrend, the indicator below 50, respectively, a downtrend. If the indicator fluctuates around zero, it means that the market is in a flat. It is customary to distinguish levels 70, 50 and 30 on the Arun indicator (Fig. 4), the crossing of which gives a clear picture of what is happening in the market.
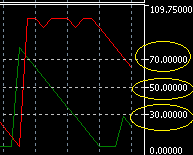
Image 4
If the Aroon Up line moves between 0% and 30% it is seen as a signal of a possible uptrend formation, but only possible.
If the Aroon Up moves between 30% and 70% it already increases the probability of an uptrend.
So, if the Aroon up is placed above 70% for a long time, while the second line cannot reach the 30% level, it indicates a strong trend.
If the line Aroon up is constantly near the value of 100, it means that the market is dominated by buyers, especially if the line Aroon down fluctuates near zero. If the Aroon Up has crossed the level of 100% from the bottom to the top, it indicates a strong uptrend.
If the Aroon down line breaks through the 100% level from the bottom up, it is a sign of a strong downtrend.
If Aroon down moves at the level of 100, and Aroon up in the lower part of the indicator (Fig.5), it indicates the unconditional dominance of the sellers.
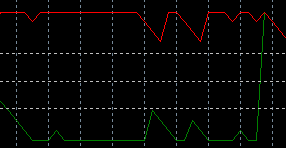
Image 5
Aroon down movement between 70% and 100% signals that the downtrend is strengthening, especially if the Aroon up is placed between 0 and 30%. That a downtrend is very likely is indicated by the movement of the Aroon down line between 30% and 70%.
The movement of Aroon down between 0% and 30% indicates that a downtrend is forming, but so far it is unstable and a market reversal is possible.
If both lines intersect, it can indicate the end of a flat or the formation of a new trend. And if the lines are moving in parallel, then the market is dominated by a flat movement.
Aroon installation and settings
The Aroon indicator is not included in the list of standard tools of the trading platforms. In particular, for MT5 you need to download it, for example, from this link https://www.mql5.com/ru/code/21022 .
The mq5 file is downloaded to the mql5 folder on your computer, and from there it is extracted and loaded into the terminal by two clicks: File – Open Data Folder – two clicks on the MQL5 Program file (Fig.6). The indicator appears in the list of custom indicators (Fig.7).
Image 6
The default setting of the Arun indicator is 14. But the period can be changed according to strategy and goals.
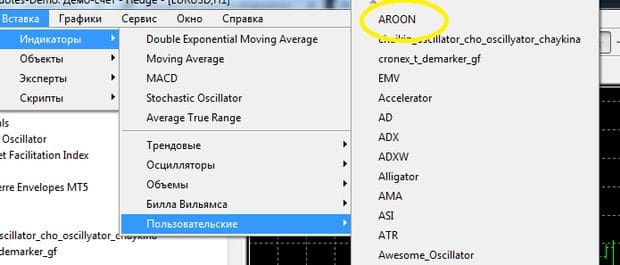
Image 7
If the period is longer, you can analyze longer sections of the trend. Most often in this case sets the period of 25. But in this case it is possible not to see the signals on the smaller sections.
A smaller period allows you to analyze small parts of the trend, to catch small signals, but in this case it is difficult to trade on long timeframes.
The standard settings of the indicator are such periods as 14; 25. At period 10 short-term trading is carried out, and at period 50 long-term transactions are concluded.
Strategy with Aroon
Working with only one indicator Aroon is not recommended, it gives false signals, although not often. The developer of the Aroon indicator himself did not recommend using Aroon without other indicators. Also, two Arun indicators with different periods do not work on the price chart. Also, Tushar Chand considered his indicator to be more of a forecasting tool than a trading one.
Nevertheless, there are strategies only for Aroon exists. In the case of crossing lines, when Aroon up is at the top and placed near the 70 mark, and Aroon down is at the bottom and near the 30 mark, a sell position is placed. Buy positions are placed when the situation is reversed.
With the use of additional indicators errors can be reduced. In particular, moving averages of different kinds are used with this indicator. Arun most accurately displays the dynamics on individual short-term periods, to a lesser extent it is able to see the leading trend on a long time interval.
In order to create an effective strategy, you need to add an indicator with a long period, such as a moving average with a period of 90 (Fig. 8), which will show a long-term trend.
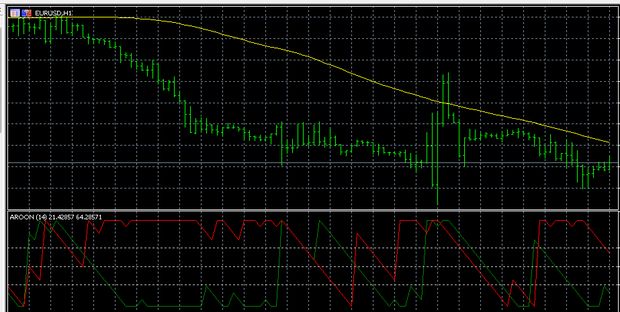
Image 8
The signal to buy will be a crossing of the Aroon up line with the Aroon down line, while the price is placed exactly above the moving average.
The signal to sell will be the placing of the price under the 90-period moving average, and Aroon up will cross Aroon down.
A strategy is also implemented using an exponential moving average with a sufficiently long period, for example, with a period of 65. If the price is placed above this line and Arun gives a standard buy signal, an appropriate position is placed.
Two moving averages with different periods can be used with the Arun indicator. For example, with a period of 5 and 20. In this case, you need to monitor the crossing of the moving averages and at the same time the lines of the Arun indicator.
There is also a fairly well-known strategy that uses Arun and another trend indicator Parabolic SAR (Fig. 9). The strategy is implemented on the timeframe of H1 and above. Aroon is set with a standard period of 14, as well as Parabolic SAR (0.02, max 0.2). At the same time, Parabolic SAR performs the functions of a false signal filter. The signal for placing orders will be a crossing of the lines of the Aroon indicator.
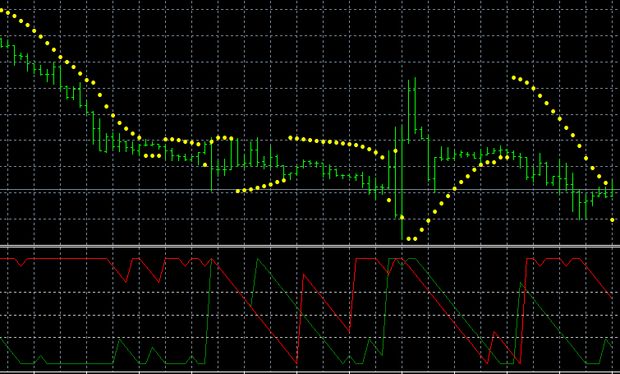
Fig. 9
The conditions for opening a buy position when the line Aroon Up crosses the line Aroon Down from bottom to top, at that the indicator Parabolic SAR is placed below the price, the bar on which the trade is carried out, must be ascending.
The conditions for opening a sell position are formed when the line Aroon Up crosses from top to bottom the line Aroon Down, with the indicator Parabolic SAR is placed above the price, the transaction is carried out on the downtrend bar. In addition, it is necessary to set a stop loss at the level of the Parabolic indicator.
Another strategy involves the use of Aroon with a period of 25, together with Parabolic Sar and the Zig Zag indicator. The main long-term trend is determined by Parabolic Sar and refined by Zig Zag.
Orders are placed by signals similar to the previous strategy. A buy position is opened when the Aroon Up line fluctuates around 70%, while Aroon Down is below 30%. The Parabolic SAR should be placed below the price and the Zig Zag shows an uptrend. A sell position is opened when the Aroon Down line fluctuates around 70%, with the Aroon Up below 30%. At the same time Parabolic SAR should be placed above the price and Zig Zag shows a downtrend.
Arun is used in the strategy with T3_MACO indicators, ADX and moving averages 5 EMA, 50 EMA and 20 WMA. It can be traded on any timeframe. The T3_MACO indicator is a modification of the usual MACD indicator, only T3_MACO is not displayed as a histogram, but as a line similar to the MA, but not on the price chart, and in a separate window of the trading terminal.
ADX indicator (Average Directional Index) is one of the popular indicators, which can be used to determine the strength of the trend and predict its dynamics. In this strategy, the indicator is set with a period of 14.
Buy positions are opened when the price is above the EMA (50), the moving average EMA (5) crosses the WMA (20) from bottom to top. At the same time, the line indicator Aroon Up crosses Aroon Down from bottom to top in the range from 40 to 80. In addition, the indicator T3_MACO must zero up, and the line +DI indicator ADX must cross the line -DI upwards.
Conclusion
Arun is a non-standard small system of indicators to determine the dynamics of the trend, so it is used relatively infrequently. Arun is not the most complicated indicator, but interpreting its signals and using it in practice requires skills.
The usefulness of Aroon for trading is that it allows you to fairly objectively assess the situation on the market, see a flat movement or trend at any stage of development. It is characterized by a fairly high degree of reliability, rarely generates false signals, gives accurate trend reversal signals. At the same time, the Aroon indicator signals are unambiguous in interpretation.
The disadvantages of the indicator are lagging in the movement of signal lines Aroon Up and Aroon Down, especially with sharp changes in market dynamics. Therefore, it is desirable to use it with other indicators and oscillators and if you have certain skills in the forex market.