Indicators for Forex
There are different ways to trading in the forex market. Many traders prefer to trade Price Action, focusing only on the price chart. But most traders use technical analysis indicators.
Contents
- 1 What are indicators and what are they for?
- 2 When did the indicators appear?
- 3 Types of indicators
- 4 Indicators for forex and not for forex
- 5 Indicators for Binary Options
- 6 Indicators for the stock market
- 7 Platforms with indicators for forex trading
- 8 Indicators in forex broker terminals
- 9 MT4 and MT5 indicators
- 10 How to add an indicator to MetaTrader4 chart?
- 11 What to do if the platform does not have the right indicator?
- 12 Forex indicators that you need to know
- 13 Indicator signals
- 14 Conclusions
- 15 MT4 and MT5 indicators
- 16 How to add an indicator to MetaTrader4 chart?
- 17 What to do if the platform does not have the right indicator?
- 18 Forex indicators that you need to know
- 19 Indicator signals
- 20 Conclusions
What are indicators and what are they for?
Technical Indicator is a function that is determined by the price movements of an asset. With the help of indicators, traders seek to predict future price movements. Technical indicators are not suited for analyzing fundamental factors, such as income or margin, because they are designed for relatively short-term price movements. Therefore, technical indicators are of little interest to investors or traders who rely on long-term strategies.
What do technical indicators give to a trader? They significantly reduce the time to make decisions based on previous price movements. Trading with indicators can be done even in automatic mode. Making decisions following the indicators reduces the stress load on the trader, gives him confidence in his actions. Forecasting with the help of indicators is more precise, based on real price data and excludes emotional component. Finally, indicators allow you to organize the information about what is happening in the market and to analyze it – it allows you to avoid mistakes in the future.
Technical indicators allow you to trade more flexibly, create and implement strategies of any complexity. At the same time, learning to trade with the help of indicators in most cases is not very difficult. Also, technical indicators can be used to confirm conclusions made on the basis of fundamental analysis. In the modern market prices change very quickly, relying only on fundamental analysis, you can not have time to make the necessary operation. Technical indicators allow to avoid this.
Indicators are chosen depending on the strategy that the trader plans to implement in the market. When choosing an indicator, one should consider the effectiveness of the indicator on different timeframes, on long-term, short-term and medium-term transactions, such information can be found in the trading terminal, where the indicator is presented or on third-party resources on the Internet.
It is also necessary to pay attention to the compatibility of different indicators, if it is planned to use several instruments at once. In spite of the fact that the main trader’s tool is his practical trading skills, a certain theoretical preparation is necessary for the use of indicators. That is, to understand how an indicator works and how useful the information it gives is necessary before you start trading. And, as usual, first of all, the peculiarities of indicator application must be tested on forex demo account. It is necessary to check the efficiency of the indicator in relation to the chosen strategy and do it yourself, not on the videos of other traders.
When did the indicators appear?
Technical indicators emerged from a theory developed from articles by the American financial journalist Charles Dow, the first editor of the Wall Street Journal. The main tenets of the theory include the following:
- There are three types of trends – long term, intermediate and short term;
- The primary trend has three phases: accumulation, participation and realization;
- The market reacts to the news;
- The trend is confirmed by the volume of trading;
- There are unambiguous signals about the end of the trend.
The application of this theory in practice led to the emergence of many indicators. Most indicators appeared in the era before the Internet. But the heyday of creation and implementation of indicators in trading and their mass application began with the rapid development of Internet trading.
Technical indicators are used in trading any asset – stocks, forex, futures, commodities, interest rates and cryptocurrencies. Technical indicators are traders’ tools that, based on information about the price of an asset, make calculations and present the result-signal to the investor. Based on this result, the trader either performs trading operations himself or they are executed automatically. Technical indicators take into account only price movements and do not consider fundamental market factors, but it is preferable for a trader to be aware of the situation on the market in general.
Indicators are lines, histograms and other objects that are automatically plotted on the chart according to a specific formula that is set when programming the indicator. Variables in the formula are specific price values. When setting up an indicator, a trader can introduce some parameters himself, but information calculation is done automatically. The speed of indicators, when properly configured, gives the trader a great advantage in trading.
After determining the parameters the indicator is visualized on the chart and the trader gets a clear signal, on the basis of which performs the necessary actions, – entry or exit trading, selling or buying an asset. Indicators can be used by novice traders, but to a greater extent, indicators are useful for fairly experienced traders. Experienced traders can also create their own narrowly focused indicators.
There are a lot of technical analysis indicators, they have different value, efficiency, complexity, information coverage, their advantages and disadvantages. At the same time, not all indicators are effective and not all effective indicators are always effective. But few can achieve high results in trading without the use of indicators.
Top 3 best forex brokers: test their terminals
| Broker | Bonuses | Open an account |
|---|---|---|
|
1
|
50 %
Bonus on deposit from $100 USD – promo code WELCOME50
|
Start |
|
2
|
From 25 To 60 %
Deposit increase for the first deposit
|
Start |
|
3
|
Cashback
Refunds of commissions, spreads and other costs
|
Start |
|
4
|
100 USD
Loyalty program remuneration
|
Start |
|
5
|
20 %
Bonus and cashback by promo code revieweek23
|
Start |
Types of indicators
Indicators can be divided into several types:
- Trend indicators are the most popular, they are designed to determine the direction of the trend and the trend reversal point. Trend indicators follow the price, that is, they are to some extent lagging behind price changes. The trader confirms the price dynamics with the help of trend indicators. But he also has time to react to the information provided by the indicator, because there are signs which allow predicting the change of the trend with sufficient confidence.
The main task of a trader, when using trend indicators, is just to be able to interpret the information of the indicator, predict what the price will be based on the signals, provided by the indicator, and take the right action. Trend indicators are more informative when the trend is clearly expressed.
- Indicators-oscillators are considered to be ahead of the curve (e.g, Chaikin Oscillator, Accelerator Oscillator, Linear Regression Indicator). They are also based on price dynamics, but they show fluctuations – deviations of price from its average value, i.e. they do not show price values, but relative to the price. Oscillators in the trading terminal are set below the chart. Most often oscillators are used to determine if the market is overbought or oversold, they can confirm the trend strength and help to specify signals about the market entry or exit. Oscillators, as a rule, are more informative when there is no clear trend.
- Volume indicators are mostly used in trading in stock markets. In the forex market, indicators that analyze tick volume – the frequency of price fluctuations during a certain time period – are used as analogues of volume indicators. These indicators show how active trading is, allowing you to assess whether an asset is in demand.
- Indicators that give indirect signals can include the so-called psychological indicators – consensus indicators and commitment indicators.
The market is filled with the predictions of numerous specialists, including those who overestimate their understanding of the market – and there are many more of them, and it is their opinion that drowns out all others. And when such forecasters express a consensus opinion that the trend will develop in a certain direction, traders bet on the opposite trend. That’s how the consensus indicator works.
Commitment indicator implies that the trader is guided by information from authoritative sources – the official financial institutions, knowledgeable big players, analytical agencies, the accuracy of forecasts confirmed by practice, and so on.
Perhaps the most popular indicator is the moving average (Moving Average It is likely to be used in all indicator trading strategies. The MA is a fairly simple indicator, it represents a line consisting of points, each of which shows the arithmetic average of price values over a certain period of time. In general, the MA shows the average price and the trend direction, smoothing out frequent price fluctuations, the so-called “noise”.
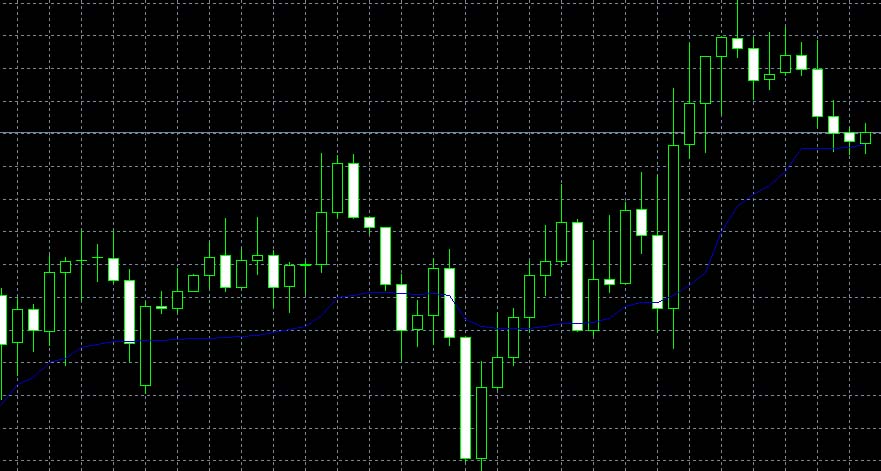
Image. 1
The period for drawing the MA is determined by a trader according to his objectives, taking into account market volatility and trading tools used. As a rule, closing prices are used for drawing MAs, though other prices can be used as well – openings, extremums and others.
MACD indicator refers to both trend indicators and oscillators. MACD evaluates the convergence and divergence of two moving averages constructed on different time periods. The greater the distance between the MA, the stronger the trend is considered to be, besides, the indicator allows to determine the direction of the trend.
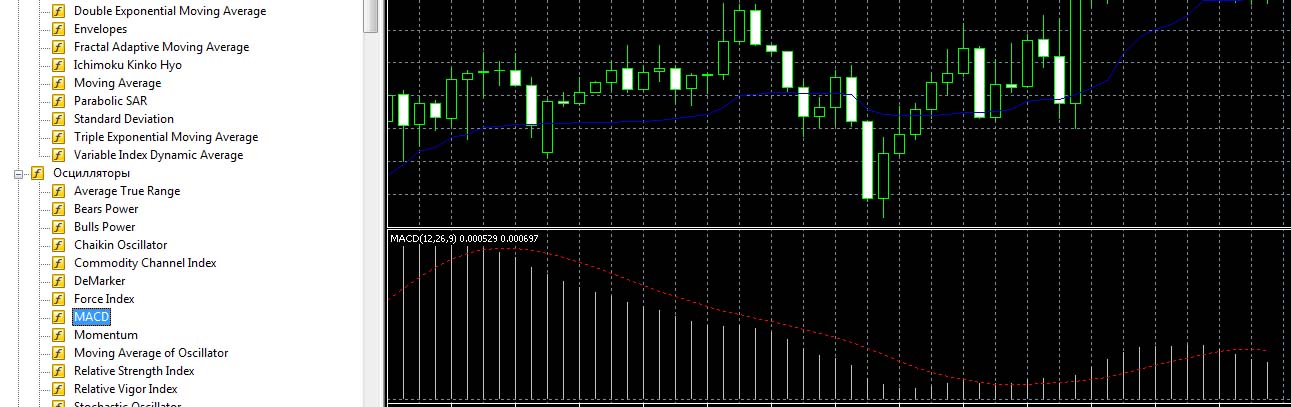
Image. 2
Stochastic (Fig. 3), an indicator that consists of a moving average and a line of price ratio to its previous values for a certain period of time. The price of the asset when traded constantly seeks to average, that is, the balance between buyers and sellers, respectively, the greater the divergence between the monitored average lines, the more pronounced the trend becomes. Stochastic is used to exclude false signals, as it allows you to accurately identify the dominant trend.
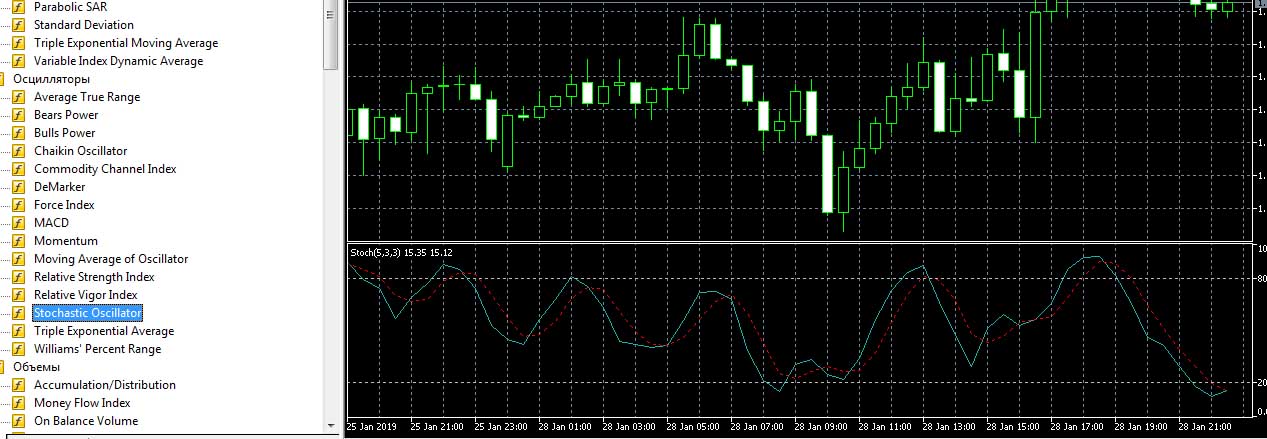
Image. 3
Oscillator RSI or “Relative Strength Index” is similar to Stochastic, but does not have MA. The RSI correlates average closing prices on an uptrend with closing prices on a downtrend, which allows you to determine the speed of price change and the strength of the trend. The index values are defined in the range from 0 to 100. The RSI is visualized on the chart as a regular curved line, which makes it easy to determine the direction of the trend. Traders can look for chart patterns on the line to predict price dynamics; evaluate peaks and troughs on the line to predict possible extremes; and analyze support and resistance levels.
Bollinger Bands – trend indicator consisting of three lines: a simple moving average (Simple Moving Average), exponential (Exponential Moving Average) and weighted (Weighted Moving Average). The indicator is used to determine the trend direction and shows the degree of volatility. The action of the indicator is based on tracking strong deviations from the current stable pronounced trend.
Another oscillator indicator from the list of the most commonly used is Momentum. This is one of the simplest indicators, which, in addition, can be used as a leading indicator. Momentum shows the speed of price change in the selected time period. The optimal use of Momentum is considered on the medium and long-term transactions. This oscillator is used to determine the long-term trend and its strength.
Indicators for forex and not for forex
Forex market indicators are tools for predicting the movement of currencies, the main task of which is to give signals that will allow the trader to determine the best time to open and close transactions.
There are a huge number of indicators on forex trading platforms, there are frequently used, almost universal, but there are also specific indicators developed for different platforms, different operations, situations in the market, for a variety of strategies, including highly specialized custom indicators.
Forex indicators are designed to help the trader to make more informed decisions, they remove market noise, confirm the trend lines and simplify the work in the market. It is important for a trader to be able to interpret indicator information, in particular, to determine which signals are false and which are true.
Indicators are originally embedded in forex trading platforms or are downloaded by the user. They are superimposed on the chart, the trader can choose parameters, change the scale of elements, the color of elements, etc., i.e. adapt them for their perception. Many experienced traders use several indicators at the same time, such as leading oscillators and trend lagging ones. Indicators are linked in a single strategy, guided by disparate indicators, it is impossible to trade effectively.
The most popular indicators belong to the following categories: volume indicators, Williams indicators, trend indicators, oscillators and custom indicators.
- Oscillators in the forex market allow you to determine the possible change in price by tracking the dynamics of the forex market (for example, Relative Vigor Index). As a rule, low values of the oscillator in a given range of values signal a downtrend, high values signal an uptrend. Extrema are most important in this context, as they can signal a change in trend.
- Trend indicators are the easiest to understand and therefore the most popular in the forex market. Their main purpose – to give an idea of the strength of the trend and the most likely direction of the trend, including the termination of the current trend (eg, On Balance Volume, Mass Index). Trend indicators are optimal for developing a long-term trading strategy. No matter how good trend indicators are, their work is ineffective in a sideways trend. During a flat trend on the forex market, you need to turn to other tools.
- For example, many people use the Bill Williams indicators, named after their author. These indicators have a special place in the forex market. Williams’ theory, in short, is that the forex market is chaotic and that future price dynamics are not related to its past dynamics. His strategy takes into account such parameters as a fractal (phase space), driving force, acceleration/deceleration, zone (combination of forces) and the balance line. Based on these parameters, indicators are built. The difficulty in applying the Williams indicators is that the concept can only work with certain instruments. Neither the strategy, nor the indicators of Bill Williams can be considered as a panacea against losses. On the contrary, some traders consider the whole Williams’ theory to be unprofitable, but for many Williams’ findings are profitable and the strategy, as well as the indicators, are somewhat popular in the forex market.
- Channel indicators form a conditional price corridor between resistance and support lines. Traders use channel indicators to track currency prices approaching the boundaries of the conditional corridor, counting on a rebound or breakthrough, which allows profitable entry into the market. In particular, channel indicators include the Bollinger Bands, which consist of three moving bands with different display periods.
- Level indicators are not the most popular in the forex market. They consist of many lines, each showing a different group of data. These indicators include, for example, Fractals indicator, Murray levels and Dinapoli levels.
- In forex can also be used market indicators that analyze not the data of one or more of the indicators, such as the opening price, closing price (eg, Average Daily Range) and others, and a large amount of data about the market as a whole. These include. Arms Index, Ease of Movement Value and McClellan oscillator. But such indicators are rarely used because they unnecessarily complicate forex trading.
- Psychological indicators are considered as an additional tool in forex trading. They help to predict the situation on the market and its influence on the price, evaluating the behavior of buyers and sellers. They include such indicators as, for example, the Bull/Bear Ratio or Sentiment Indicator.
- Custom forex indicators are trading indicators, mostly common, working according to standard algorithms, but designed for certain situations in the forex market. They can be both very useful, created taking into account the most current market conditions, and useless. Many custom indicators are available on the Internet for free, but there are also paid indicators – thousands of different developments. In neither case is there a guarantee that custom indicators will be better than the standard indicators, pre-installed on the trading platform.
- Indicators are used in forex trading strategies, which are called indicator strategies. The trader makes his forecasts using only or mainly signals from the indicators, combining them with his own analysis of the chart.
- Traders who trade forex are more interested in indicators that are displayed on the chart itself, because it allows you to quickly determine the price in real time and predict its movement. Lagging indicators are needed to confirm a trader’s conclusions.
When choosing an indicator for forex trading, a trader should have a clear idea of what exactly the indicator shows – support and resistance levels, trend strength or something else. Whether the indicator is leading or lagging. It is necessary to determine the time frame which the indicator is to be adjusted to. It is necessary to examine the history of the indicator, trying to identify the regularities characteristic of its work. Then choose the optimal parameters and test the indicator on a demo account.
Indicators for Binary Options
If you compare forex indicators with indicators for binary options and stock markets, the principle of operation of the indicators themselves is the same. But when trading on the forex market, the trader trades according to the indicators, which are placed directly on the chart and underneath it. In case of binary options to apply an indicator to a chart, you need to find the required currency pair in the trading terminal or open a website which has both a chart and an indicator.
But some Binary Options Brokers provide the same functionality as for forex trading. In this way it is possible to trade binary options, for example, on the MT4 platform. Forex indicators for binary options require more customization to the trading tools used.
Indicators for the stock market
In the stock market it is possible to apply the same indicators as in the Forex market, but there are some differences. For example, the market volume can be called the next important indicator for the trader after the asset price. Volume indicators show the total number of deals in a certain period of time on the market. This allows the trader to determine the activity of traders in the market and the dominant trend. As well as track the beginning of a change in the trend, which can be indicated by the divergence of volume and price. But it is impossible to determine the market volume on the Forex market, but on the stock market you can (Training in Stock Market Trading).
At stock market there are specific indicators (although you can find similar indicators on the principle of action in Forex), for example, this:
- New Upper-New Lower Price Index (NH-NL), which is calculated by the difference between the number of stocks with upper prices and stocks with lower prices in a certain period. The number of market leaders is determined by the top and bottom stocks in a given period. This index confirms the trend direction.
- The Trader’s Index, TRIN, is a leading stock market index that shows the mood of players in the market: if the mood is optimistic, it is expressed by a peak, if pessimistic – by a trough. It is calculated as the ratio of the number of rising stocks to the number of falling stocks.
- Rising – falling lines (ADVANCE-DECLINE) or A-D, show the mass participation of traders in the trend. The indicator is calculated by subtracting the number of falling stocks from the number of rising stocks, the difference is added to the previous value and the summing line A-D is constructed.
- The Most Active Stocks indicator (MAS) is a line. The A-D line is the 15 most active stocks of the New York Stock Exchange (NYSE), it is calculated daily and shows with a high degree of probability where the market will move.
At stock exchange More attention than in any other market is paid to the analysis of the fundamental factors influencing the trade.
Platforms with indicators for forex trading
MetaTrader 4 (https://www.metatrader4.com/) one of the popular platforms for forex trading, it is the main platform for most traders. The platform is quickly mastered by novice traders, presents great opportunities for technical analysis with the help of several dozens of technical indicators, in addition, there is access to a library of free custom indicators and a store for the purchase of paid ones.
MetaTrader 5 (https://www.metatrader5.com/) superficially differs very little from the previous version of the terminal, but still different: there are additional tabs in the quotation window, you can see the features of a particular trading instrument and trade in one click without a chart. On the chart trader can conduct automatic trading already in the basic version of the platform, you can order a trading bot on a freelance platform, created for the platform. In the “Navigator” section of the terminal you can rent a VPS server through the terminal. Traders can choose between two types of trading on MetaTrader 5 – combine all trades into one or make several trades for the same asset. Some innovations of MT5 were so successful that they were transferred to MT4. At the same time, custom indicators cannot be installed on the web version, although the built-in indicators are sufficient for any strategy.
Mirror Trader provides an opportunity for independent trading using indicators. Trading is done through a web terminal, oscillators and indicators are applied to the charts – the choice is sufficient for trading according to any strategy. It is possible to view other users’ trading history, buy and sell positions. But this platform is more for selecting and copying existing strategies, for trading by signals by subscription.
Ninja Trader (https://ninjatrader.com/ru/) – a universal trading platform with extremely extensive functionality, albeit somewhat difficult to learn and use, including because of the huge analytical toolkit. The platform allows you to trade with more than 100 built-in indicators, you can implement third-party indicators or develop and implement your own indicators without knowledge of programming languages. A special feature of the platform is the “Market Analyzer” service, which itself performs the functions of many indicators and shows the parameters of the price dynamics – extrema, Stochastic, moving average, and so on – in the “Forex Chart” all this is presented in graphical form.
cTrader (https://spotware.com/) is similar to MT4 and MT5, but has differences that make the platform have a large and stable audience of traders. The platform works in desktop and web versions. On the platform you can trade using about 70 indicators, opening and closing trades directly on the chart.
Indicators in forex broker terminals
When trading through Forex brokers In order to be able to use the indicators of certain trading platforms, you need to know which brokers work with which platforms:
Roboforex is one of the largest trading brokers, offering many services and applications for trading. It is most popular among traders who use trading advisors. It regularly publishes analytical reviews on the markets of popular trading assets, online analytics of Dow Jones and Trading Central. In the Signals section, it offers MA10, MA20, MA50, MA100, MACD, BBands, Ichimoku, Stochastic, Williams, ZigZag technical indicators and market sentiment graphs. RoboForex broker offers trading terminals: MT4, 5, R Web Trader, R Mobile Trader, R Trader.
One of the largest brokers. The company provides several trading platforms for trading operations: MetaTrader4, MetaTrader5, Libertex (from the browser without downloading), Libertex application (for iPhone and Android). Additional trading platforms Rumus, Forex Club Order (advisor), Metatrader 4 advisors are also available. Automatic trading on MT4 and MT5 is possible. The broker renders analytical support for the clients, – economic calendar, news, Forex quotes by different categories. RUMUS – the trading platform of fxclub’s own development, a small number of author’s indicators are developed for it.
One of the oldest brokers, working all over the world. For trading, the broker offers popular terminals: MetaTrader 4, MetaTrader 5, OptionTrader and mobile applications for iPhone, iPad, Android. It offers extensive analytical support, with reviews of significant events, trends, trends, Dow Jones news, expert opinions, and a special trader’s calendar from FX street. Also Alpari presents analytics from Trading Central, the Autochartist service, and regularly puts out a review of popular financial instruments.
Multifunctional trading service that offers working on the platforms FxPro MT4, FxPro MT5, cTrader, FxPro Markets, applications for iPhone, iPad and Android. Provides services of technical and fundamental analysis. Traders can get news from the broker through the MT4 terminal, as well as Trading Central trading signals. There is a service FxPro Quant – strategy creation system to run on MT4 and cTrader and cAlgo – application for developing algorithmic trading strategies and custom indicators.
One of the largest multifunctional brokers. It offers trading on platforms MetaTrader 4, Forex4you WebTrader, Forex4you Desktop and mobile applications for iPhone, iPad and Android. The analytics is presented by Trading Central with Autochartist application, it provides graphical analysis of the possible trend development, key levels by indicators, trend strength analysis and search for reversal points by Japanese candlesticks. Through the Share4you service for copying trades you can subscribe to the signals.
- Fibo Group (website: https://www.fibo-forex.org/)
International broker, provides the opportunity to trade on terminals MetaTrader 4, MetaTrader 5 and cTrader. There is quite a lot of educational information, a large analytical section, automatic trading, a set of signals from MT4, explanations of the indicators within the training.
A very large and very active forex broker, offers traders trading on MetaTrader4, MetaTrader5, MT4 both in desktop and web versions. MT4 also has an MT4 Supreme Edition brokerage extension, Signal Manager.
As you can see, most major brokers offer traders MT4 platform for trading, less often – MT5 and in third place, apparently, cTrader.
MT4 and MT5 indicators
The MetaTrader4 platform offers a large selection of indicators, probably the largest number of indicators among all platforms, taking into account custom indicators, and developed the largest number of methods of their application. Also MT4 is most often used by forex brokers.
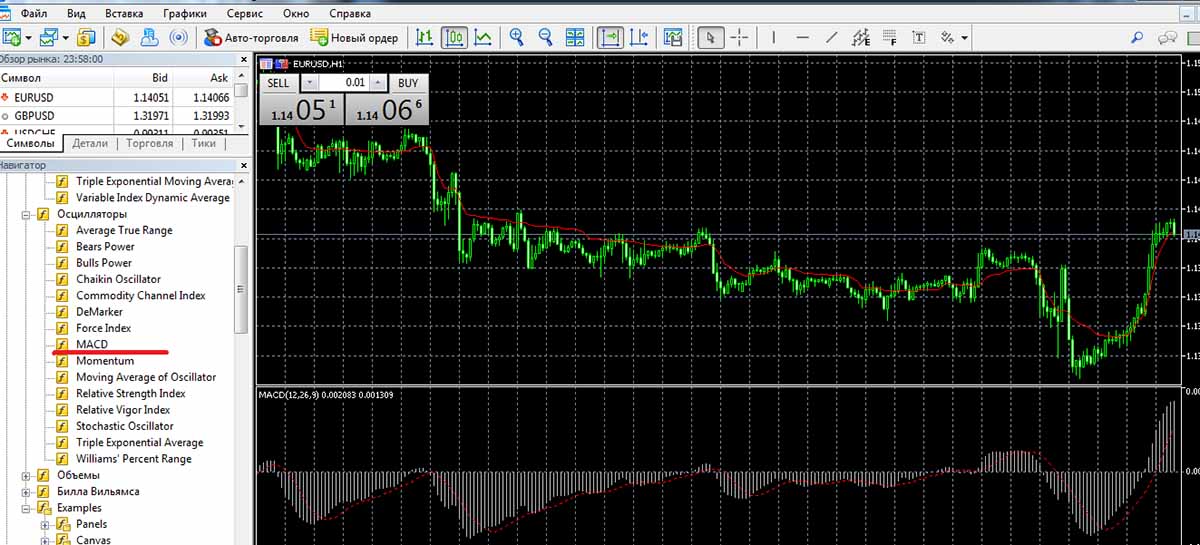
The OBV indicator, – balance volume, – is one of the simple indicators, which can be leading. It is visualized on the chart as a broken line, confirming the trend direction. The indicator is calculated by the closing price of the current bar – if the price is higher, the value of the bar is added to the previous value; if the closing price is lower than the previous bar, the volume is subtracted from the previous value of volume. It is considered that volume changes precede price changes and trend formation.
Popular MT4 indicators include MFI – The Money Flow Index, which characterizes market behavior after a change in volume. It acts similarly to the RSI indicator, taking into account, in addition to the moving average indicators, the volume indicators as well. Like the RSI, the values vary from 0 to 100, but the numbers are not as important as the dynamics. Overall, the MFI shows how interesting the currency is during the trading period. The indicators are located to the left of the trading charts in the corresponding folder.
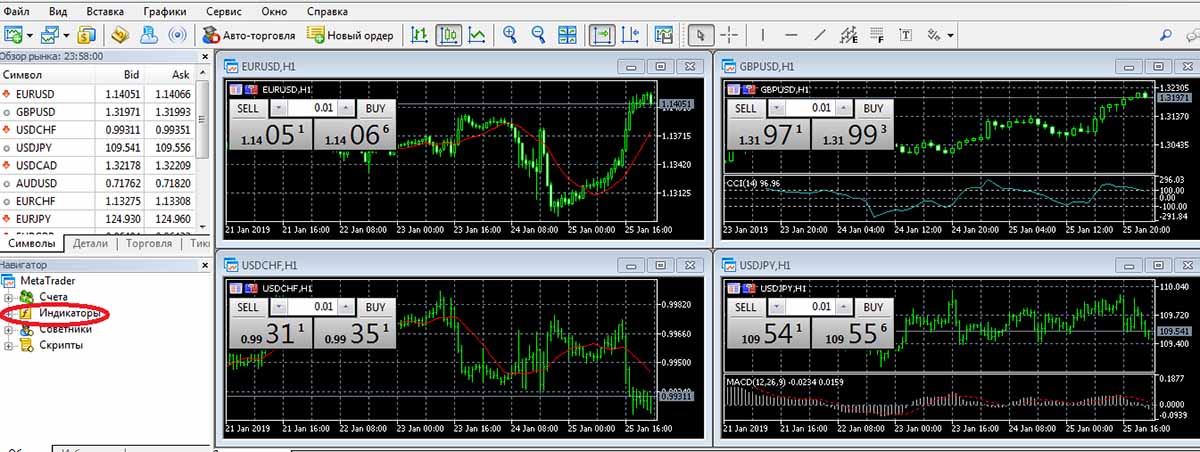
Image. 4
How to add an indicator to MetaTrader4 chart?
To run the indicator, you need to select the appropriate one from the list provided, for example, Adaptive Moving Average and click on the folder with the indicator.
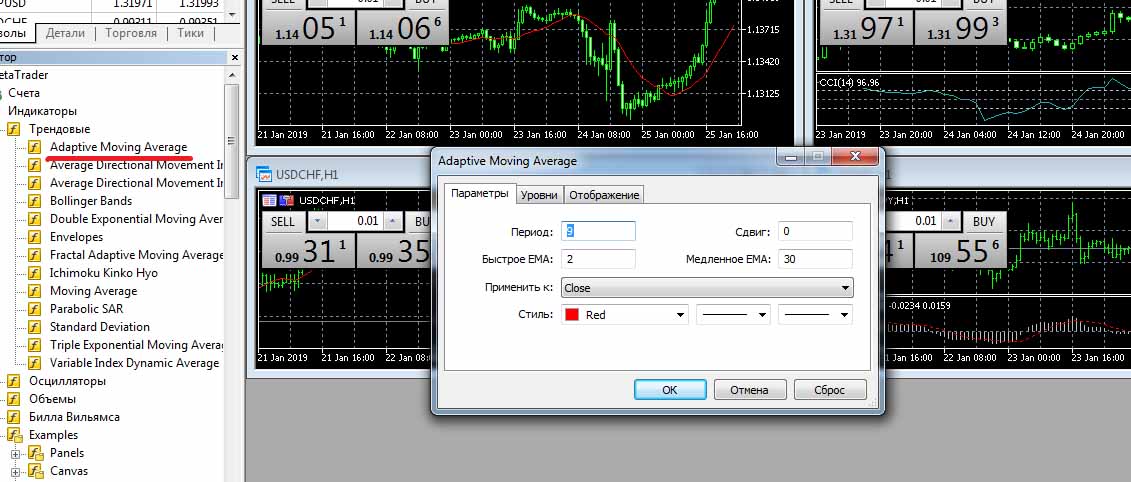
Image. 5
In the center of the terminal interface there will be a window where you need to set the necessary parameters: periods of fast and slow EMA, levels, timeframe and others. After selecting the parameters, press the “OK” button and the indicator will appear on the chart.
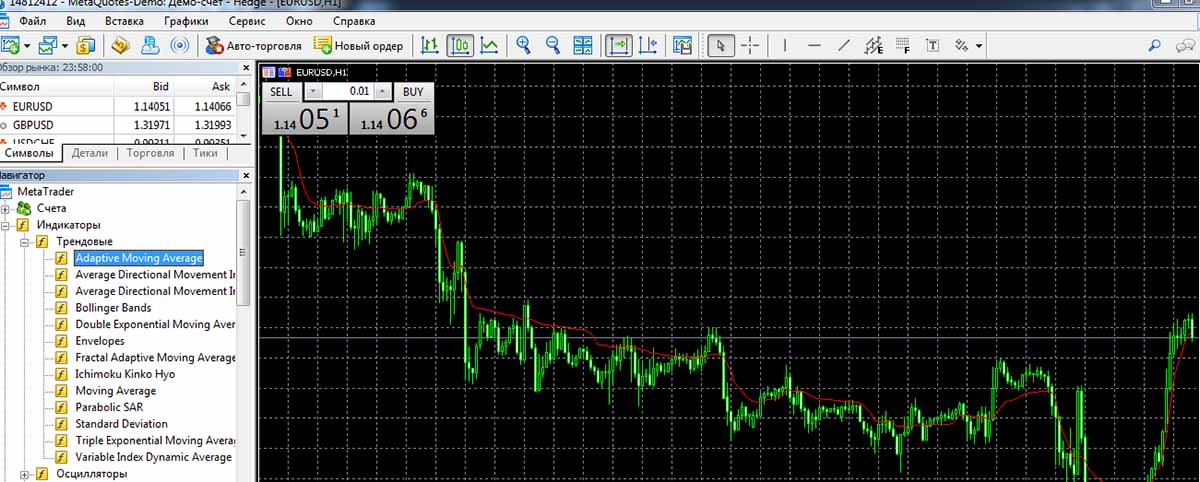
Image. 6
You can view the list of indicators in the chart, change the indicator parameters or delete it by pointing the mouse cursor to it and right-clicking, causing a menu.
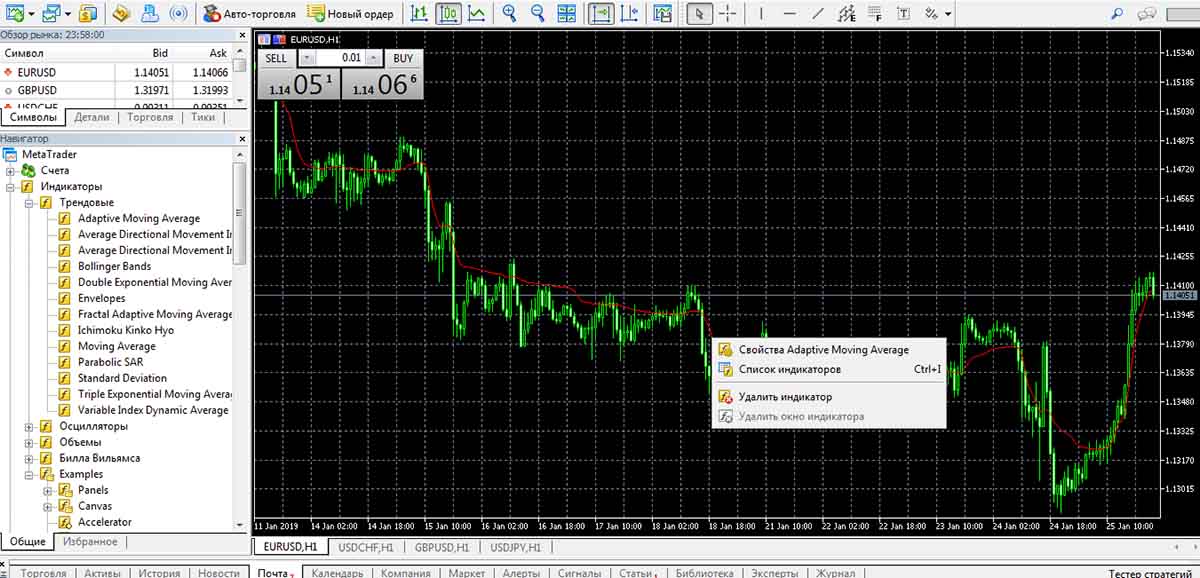
Image. 8
The oscillators are set in the same way. The oscillators are displayed below the graph.
_
What to do if the platform does not have the right indicator?
Custom indicators written in the MQL4 programming language can be downloaded to the MT4 platform. Most of them are free. The process of downloading is not complicated, though, if you go through it several times. Suppose a trader needs an additional indicator for trading. There are a lot of third-party sources of indicators on the Internet, but it is optimal to use indicators provided by the community of traders of MT4 platform itself.
Image. 9
In the list of indicators you can choose, for example, Channel.mq4. Going to the page with the indicator, you can see its rather detailed description and, if you like the indicator, download the zip-archive.
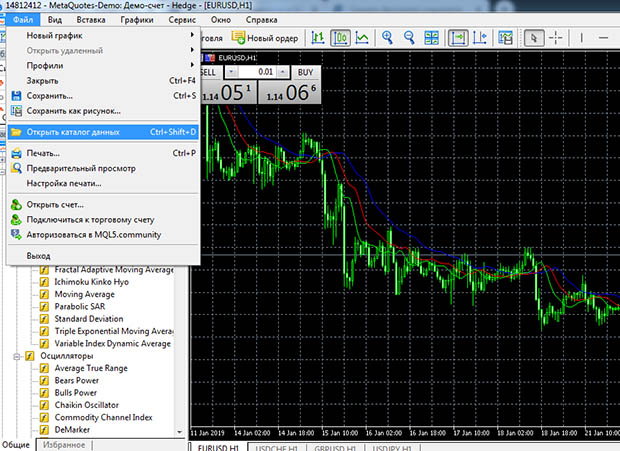
_
After unzipping the zip file, copy the files into the MQL4/Indicators folder in the Data Folder. The Data Catalog is located in the “File” section of the terminal.
_
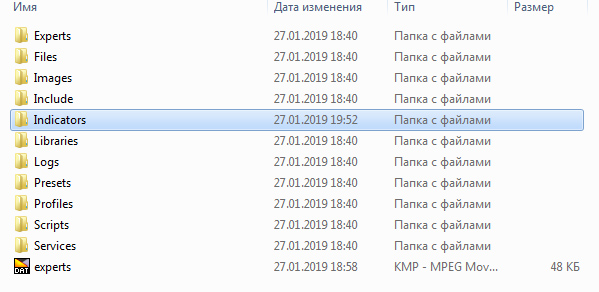
In the data directory you need to find the appropriate folder, in this case it’s “Indicators” folder, and copy the indicator file into it – it’s a file in .ex4 and/or .mql format. By the way, the file can be in the format .dll, then it is saved in the folder “libraries”.
_
In order to load the indicator on the chart, you need to return to the trading terminal, go to “Tools”, “Settings” tab and in the center of the terminal a window will appear, in which you select the “Expert Advisors” tab, where you fill in the necessary parameters for the trader, press “Ok” button and the trading terminal is reloaded, after which the indicator is installed. In order to use it, you need to enter “Insert” section in the terminal, select “Indicators” section and choose “Custom” in it and select the installed indicator.
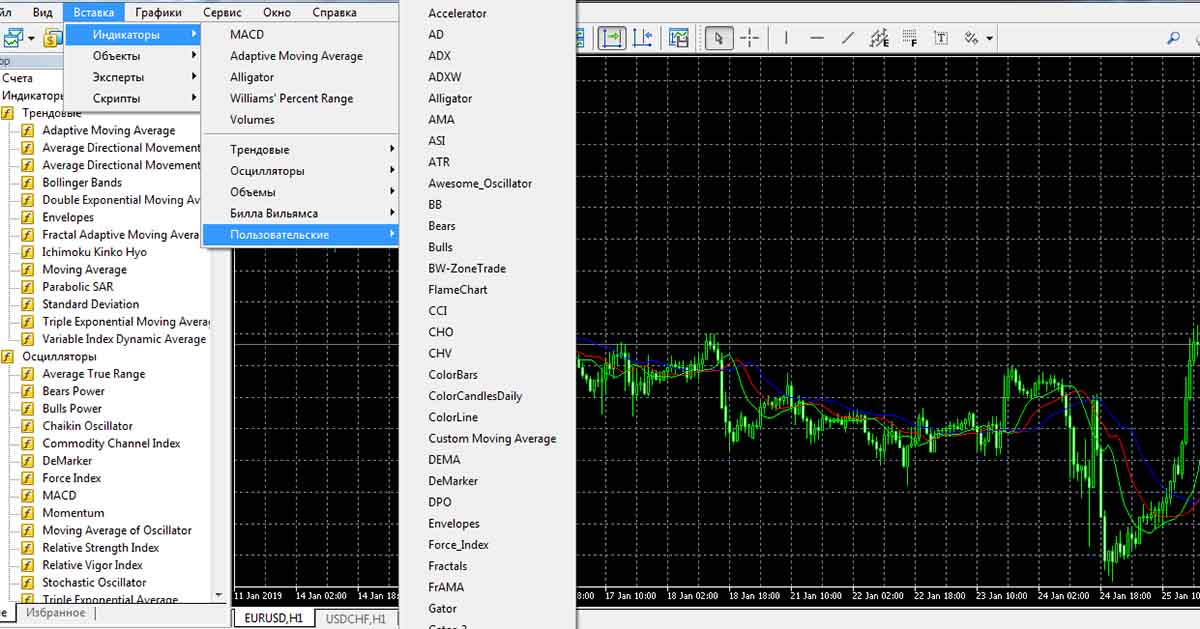
Image 13.
After that, in the center of the trading terminal will be a window with the settings of the indicator, the trader selects the desired parameters, presses “Ok” and the indicator appears on the chart.
Metatrader5 also provides a wide range of indicators, both known from MT4 platform and new ones. Popular on MT4 indicators include, for example, the adaptive moving average AMA. This indicator was invented by trader Perry Kaufman to solve two main problems of standard moving average: on small averaging period moving average gives a lot of false signals, and on long period it is too late. The AMA moves more smoothly during a flat period and shows prices more accurately when there is a clear trend.

Image 14
Another popular ADMI indicator, version ADX indicator, an index of the average direction of movement. The indicator is needed to determine the trend, the best time to buy, sell and fix profits. ADMI allows you to determine the trend more correctly. The indicator consists of three lines, displaying, respectively, the growth of price, falling prices and the trend.
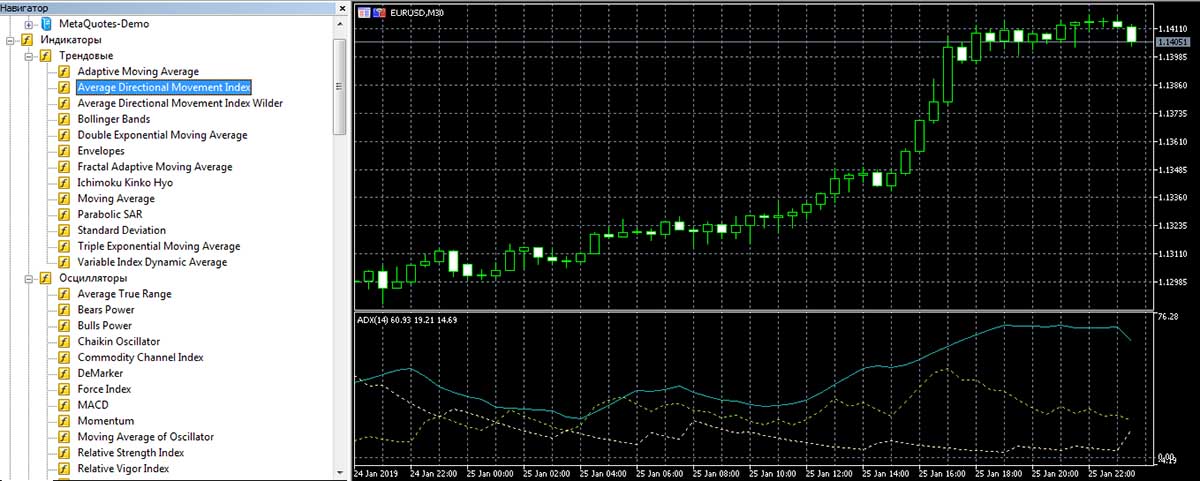
Image 15
Envelopes indicator is considered a highly accurate indicator that helps beginning traders learn to determine the trend direction. It is constructed of two trend lines, the horizontal position of which indicates a flat, while sharp changes show where the trend is headed.
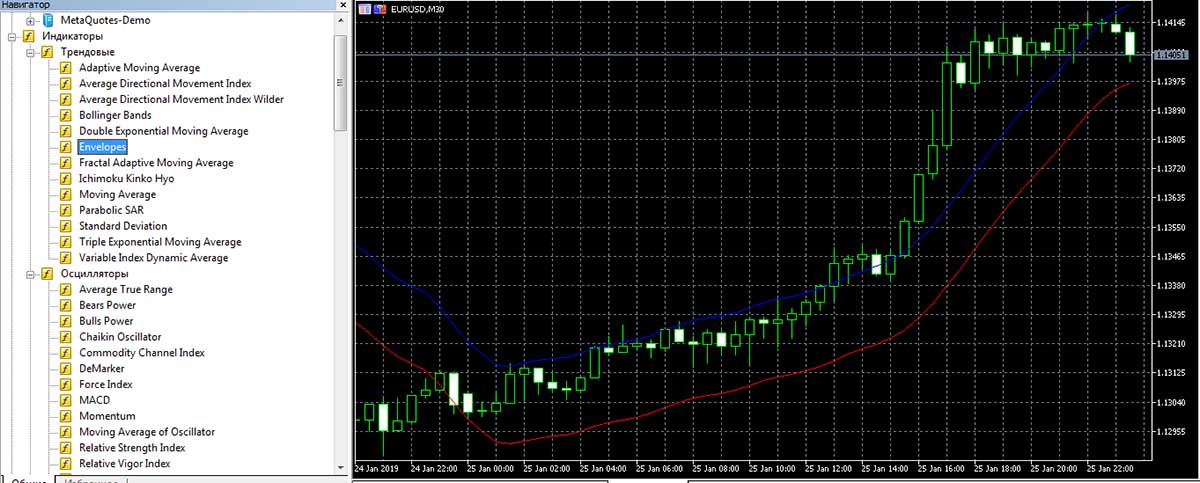
Image 16
EMA indicator is an exponential moving average, also often used on MT5, as well as on MT4. The purpose of EMA – to reduce the lag of signals, which is achieved by the method of price calculation, which takes into account the value of the price of the previous trading session.
One of the popular indicators of recent times, FRAMA, the Fractal Adaptive Moving Average. The action of the indicator is based on the fractal theory of financial markets, which states that modern price movements depend on past price movements and that price movements within one interval are similar to price movements in another interval. The FRAMA indicator detects the fractal dependence of price on different intervals and calculates the smoothing coefficient of the EMA. FRAMA more clearly follows strong trends and also clearly slows down during consolidation.
Loading of standard indicators on the MT5 chart is similar to MT4. In the MT5 web terminal it is possible to download from the Market of the terminal.
Image 17
After downloading from the Market, the indicator is loaded into the desktop terminal as follows: “Insert” → “Indicators” → “Custom” → Indicator.
MT5 Market is a full-fledged online store, where you can also get free indicators. But you can choose them not only by price, but also by indicator type, reviews, rating, popularity and other parameters. But on the site you can act as a developer and seller of indicators.
Third-party indicators on MT5 are installed similarly as on MT4, the only difference is that permission to import DLL files into the terminal is given in the “Expert Advisors” tab, which looks different than on MT4.
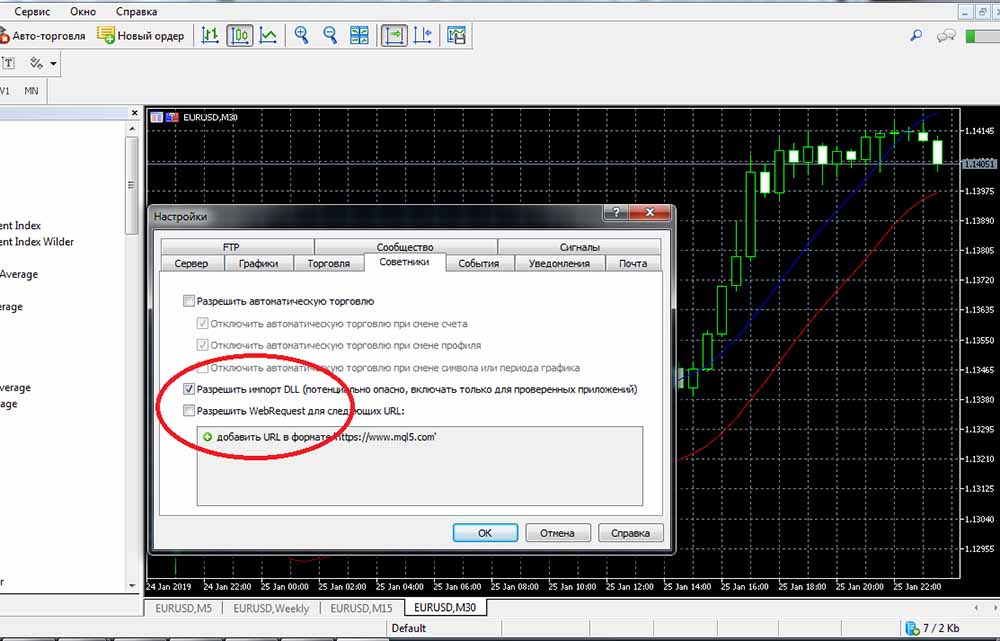
Image 18
When choosing and downloading an indicator, especially a third-party indicator, you should not forget about the need to test its functionality on a demo account. You can use MT5 indicators not only for trading on the MT5 terminal, but also when trading on the brokerage trading platforms, if there is no possibility and necessity to set indicators on third-party platforms. In this case it is important for a broker to use the same quotes as MT5. The sources of quotes on Metatrader5 are Integral, Hotspot FX, FastMatch, Currenex, FXCM Pro, LMAX Exchange, Swissquote, Alpari.
Forex indicators that you need to know
In addition to the previously listed several basic indicators, it is desirable and even necessary for a trader to know a few more tools and be able to apply them in practice. Let us briefly list them.
Trend indicators
The simple moving average, the basis of technical analysis and the most common indicator. It is standard for any trading floor. This indicator is used to determine the direction of the trend. It represents the arithmetic average of prices, such as closing prices. If the line is directed upwards, the price rises; if the line is directed downwards, the price falls. SMA is suitable for any timeframe, for any currency pair, the user can introduce the individual parameters of the indicator. For an experienced trader to understand the market situation, this line alone is sufficient, while beginners require additional indicators to clarify the indicators.
WMA, Weighted Moving Average. This indicator is aimed at solving the same problems as similar moving indicators – it smoothes the display of price on the chart, eliminating noise, which allows you to more clearly visualize the trend direction and predict the further price dynamics. When calculating the indicator, the end price of a certain period is taken and an average of several such indicators is calculated. Among all moving averages this indicator is the fastest. WMA shows the change of trend when the price crosses the line. However, it is considered optimal to use other indicators to confirm the WMA signals.
The ZigZag indicator is a standard indicator that connects local lows and highs to cut off price noise, it also allows you to identify trend reversals. It represents straight lines, which are placed accordingly to a significant price change. ZigZag is an additional indicator, the indicator itself does not allow predicting anything. The ZigZag indicator is more suitable for situation analysis than for trading, because it lags a lot, but it defines price movements very accurately and facilitates the determination of resistance and support lines and the determination of graphical patterns.
Parabolic is an indicator, also similar to a moving average. It allows you to determine the direction of the trend and its change. It looks like a row of points above or below the price. If the price is above this row of dots then the trend is upward, if the price is below the indicator then the trend is downward. This means that Parabolic SAR can function as support and resistance lines. SAR is “Stop and Reverse”, that is, the indicator shows a change of trend, the point or bar at which the parabolic begins to move is often a reversal. At the same time, the indicator works optimally only with pronounced trends on the market.
The Aroon indicator is designed to determine the trend and local highs and lows. It is essentially a set of indicators that includes what is known as the Upper Arun, which shows how many days have passed from the beginning of the time period being tracked to the high; the Lower Arun, which shows how many days have passed from the beginning of the time period being tracked to the low; and the Arun Oscillator, which shows the difference between the Upper Arun and the Lower Arun. It is said that if the Upper Arun crosses below 50, the uptrend has dried up. If the same mark is crossed by Lower Arun, the downward trend is exhausted. In situations where Aruns cross 70, each for its own case, the corresponding trend is increasing.
- Ichimoku Cloud
Ishimoku indicator allows you to determine the market trend, support levels and resistance levels and clarify buy and sell signals. The Ishimoku indicator is quite complex, it consists of five lines:
- Tenkan-sen – the average value of the price for a certain first period of time (maximum plus minimum divided by two);
- Kijun-sen – the average value of the price for the second period of time;
- Senkou Span A is the middle of the distance between Tenkan-sen and Kijun-sen, shifted forward by a value equal to the second time period;
- Senkou Span – the average value of the price for the third time period, shifted forward by the value also of the second time period.
- Chinkou Span – the closing price of the current candle, shifted backwards by the second time period.
Oscillators
- Sentiment
Sentiment is designed to determine who dominates the market, bulls or bears. The indicator is presented in the form of a line, which moves from the zero mark. Accordingly, if the line is above zero and leads upwards, the market is dominated by bulls, if the line is below zero mark, the market is dominated by bears. The Sentiment in the form of a histogram consists of bars of 4 colors, each of which indicates a certain market sentiment. Despite the fact that the oscillator’s main task is to display the sentiment, it also allows you to determine the entry and exit points of the trades.
The DeMarker oscillator is designed to determine price depletion zones, in which extrema are most likely to occur. It is quite effective in the period of changing trends and in determining the intraday market entry and exit points. The Demark indicator ranges from 0 to 1, if the indicator value is around 0.7, it can signal a decline in price, if less than 0.3, it can signal a possible rise in price.
Bulls Power and Bears power indicators are designed to determine the strength of “bulls” or “bears” in the market. The indicators are based on a moving average, which represents the conditional balance between sellers-bears and buyers-bulls during a certain period of time. The maximum price reflects the maximum strength of bulls, while the minimum price reflects the maximum strength of bears. Accordingly, Bear Power is the difference between the minimum price and EMA, usually 13-period, and Bulls Power is the difference between the maximum price and EMA, also 13-period.
The Williams %R indicator is designed to determine overbought and oversold, it functions similarly to Stochastic. The indicator shows the level of closing price in relation to the range of extremums for a certain period of time. The indicator is situated in a certain corridor and varies from 0 to -100. If the indicator has a value around -20, then it is overbought, if it is around -80, then the price of the asset is underbought. The indicator does not predict the future, but based on the fact that the asset is overbought, then its price will soon begin to fall, if it is underbought, then the price is likely to decrease.
The CCI is a trading channel oscillator, which shows the deviation of the instrument price from the moving average. If the index is high, it means that the price is overvalued, if the index is low, the price is undervalued. That is, the oscillator can show overbought and oversold levels, which allows you to detect a trend reversal. The oscillator oscillator is visually a line ranging from -300 to +300, though values of the oscillator can be out of these limits. When the bulls dominate, the line moves near +100 and when the bears dominate, it moves near -100. Lines outside these limits are considered as indicative of the beginning of a reversal.
- Rate Of Change
Rate Of Change or RoC is one of the simple oscillators, which shows the rate of price change over a certain period of time, which allows you to understand the direction of the market. If the indicator rises, it indicates an optimistic mood of traders and growth of market activity. If the indicator decreases, it indicates the fading of activity and negative mood of traders. On this basis, the indicator can function as a leading indicator showing the trend change in advance. The basis of indicator calculation is comparison of the current closing price with earlier indicators. It is characterized by high efficiency in forecasting major market trends.
- Detrended Price Oscillator
The Detrended Price Oscillator is one of the not quite standard indicators. It is designed to determine oversold and overbought, without taking the trend into account. It is noted its effective work on short-term trading cycles.
The trend oscillator is the so-called “Average Directional Movement Index”. It consists of three lines: ADX; “+DMI” line; “-DMI” line. The indicator determines only the strength of the trend with indicators from 0 to 100. The index values less than 20 show that the trend is weak, and 20 to 50 that it is gaining strength. This oscillator does not give signals to buy or sell, it only stimulates the trader to make a decision, showing the stability of the trend.
Bill Williams Indicators
- Alligator
The Alligator indicator is one of the Williams indicators. It consists of three moving average lines with different periods. Each of the lines has a characteristic conventional name. Alligator’s jaw is a 13-period moving average, shifted forward by 8 bars. The second moving average is called Alligator’s Teeth and is an 8-period moving average, shifted 5 bars into the future. The third moving average is called Alligator’s Lips, a 5-period smoothed moving average, shifted by 3 bars. The moment of crossing of all lines shows the consolidation phase. The indicator helps to determine the signal to enter the market and to clarify the direction and strength of the trend.
Another one of Williams’ oscillators, which is an addition to the Alligator indicator, is not used as an independent indicator and is not popular at all, precisely because there are enough complications with one Alligator. The indicator is based on the values of moving averages and shows the trend direction and strength similar to the Alligator, but in a different format.
The Gator consists of two histograms of different colors on either side of the zero line. The color, location from the zero line and the value of the bars in the histogram indicate a trend or its absence. For example, if price values decrease, the histogram is red, if prices increase, it becomes green.
The “Miracle Oscillator” is also Williams’ brainchild. In fact, this oscillator is identical to the classical MACD indicator and is designed for presenting trend reversal signals. But MACD is based on closing prices, Awesome Oscillator is based on median prices and can act as a leading indicator.
Indicator signals
The most important skill for a trader who trades on indicators is to correctly recognize accurate indicator signals, cutting out false ones. Signals come in different forms, for example, many indicators are placed directly on the chart and give signals in the form of arrows, changes in the direction of the curve or change color.
Oscillators, placed below the window of the trading terminal, show the curve, the values of which must be correlated with the price fluctuations displayed on the chart, that is, the signals are not specially indicated, they must be seen by the trader.
The more professional an indicator is, the less definite signals it gives. Professional indicators are used for analyzing the market situation, on the basis of these indicators a trader determines the point of entering or exiting the trading and makes decisions about the actions during the trading. That is, such signals do not do the trader’s work, but only help him.
Indicators that give unambiguous signals and do not allow for complex interpretations are designed for novice traders. At best, the trader must be able to distinguish more or less clearly a true signal from a false one and determine the strength of the signal. But there are simple indicators that give direct instructions to buy or sell. The problem with such indicators is that they are inevitably wrong. The trader, who is aimed at long-term serious work on the market, simple indicators help to pass the very first stage of work.
A significant problem with indicators is redrawing: when you reload the trading terminal, the same indicator gives different, sometimes cardinally opposite signals. For example, before reloading there seemed to be signals of trend change from upward to downward and the trader made a sell bet, but after reloading it turns out that there was no reversal. The same can happen without reloading, but in a situation when the indicator seems to have detected and corrected an “error”. Such an indicator leads to losses when trading in real time, but if you look at its history, it turns out that it is almost perfect – there is a “rewriting of history” in the literal sense of the word.
Overdrawing indicators are dangerous to the trader, so you should read the reviews of indicators and test any indicator before using it. Testing is performed in several stages. The first stage – the indicator is run in the terminal, the trader watches its work for several days. During this time there should not be any obvious signal re-drawing to the opposite.
If this stage is passed, the trader moves on to the second stage of verification. For checking, a period of time is selected and all the signals are somehow copied – recorded or a screenshot is made, etc. The terminal is reloaded, the indicator is launched again and its values – for the marked period of time – are compared with the signals that were marked after the reload. If the signals have changed, this indicator is not suitable for use.
If the vast majority of signals remain in place after checking, then the second stage of the test can be considered successful. Next you need to check the accuracy of the signals, initially on a demo account.
Examples of forex indicator signals
Let’s look at what signals some popular indicators give. For example, the forex oscillator RSI, Relative Strength Index, is a curve and provides the following signals: RSI above level 50 promises an uptrend, below 50, respectively, the downtrend. When the RSI crosses 50, the market is overbought. If it crosses 30 on the downtrend, the market is over-sold.
The reversal levels are 70 for trend change to downtrend and 30 for trend change to uptrend. Also a trend change is indicated by interruption of the RSI and a mismatch of the Index with the price chart.
The MACD indicator functions in two versions, in the form of lines and a histogram. In the linear version, two lines are drawn – a solid main line and a dashed line, which is often highlighted in color. The main line shows the average price fluctuation and quickly reacts to the price change, the dashed line reacts slower, but estimates a longer time interval. When the signal line crosses the main line in the upward direction, a buy trade can be opened. If the signal line crosses the main line from top to bottom, this, respectively, is a signal to sell.
The position itself is also a signal for the trader. For example, if the main line is located above the signal line, then the market is dominated by bulls, if the signal line is located above the main line, then bears dominate.
The histogram version of the MACD shows the same information, but visualized differently – as bars above and below the zero mark. It is obvious that if each next bar is higher than the previous one, the market trend is ascending, if each bar is lower than the previous one, the market trend is descending. It is clear that when a column with the opposite value appears on the histogram among the columns of a certain trend, the trend can change accordingly.
The RSI and MACD signals are fairly easy to interpret. But not all indicators are that clear. Let’s consider the signals of one of the complex indicators – the Ishimoku. In general, the Ishimoku signals can be divided into just three parts:
- Signals on Senkou Span A and Senkou Span B lines and “crosses”;
- Signals on the Chinkou Span lines;
- Signals on the price chart lines and lines.
Image 19
For example, crossing the line Tenkan-sen and Kijun-sen from bottom to top is called a “Golden Cross” and signals an opportunity to buy, crossing the line Kijun-sen Tenkan-sen is called a “Dead Cross” and signals an opportunity to sell.
The Chinkou Span line displays the current price shifted by a certain number of periods, and prices of previous periods are resistance and support levels. If the Chinkou Span line touches the line in the direction from above, it signals that a downtrend is forming. If the Chinkou Span breaks the price line from below, an uptrend is forming. Clear reversal signals of the Chinkou Span are considered to be very effective.
Senkou Span A and Senkou Span B lines limit the possible price indicators, forming a so-called “price cloud” on the chart, which is marked by color depending on the trend. The crossing of the price cloud by the lines indicates the beginning of the change of the trend, which is confirmed by the change of the color of the cloud. The Tenkan-sen line performs functions of a moving average; when prices roll back from extremums the Tenkan-sen line takes the place of the support or resistance line, which may indicate a trend reversal.
On the basis of this indicator it is possible to create full-fledged trading strategies. At the same time, despite the visual complexity, the number of Ishimoku signals is limited, they are formalized enough and can be memorized and learned to recognize quickly enough.
The signals of Bill Williams’ indicators are peculiar. The alligator, to which Williams has given the maximum resemblance to the zoological prototype in appearance and behavior, having created a peculiar language, which should be understood when mastering the indicator. Alligator consists of three moving averages with different periods. “Alligator’s Jaw” marks the long-term price, Williams also called it the “Balance Line”. If the price is above the Alligator’s Jaw, it is a signal for an uptrend to continue. If the price is below the Alligator’s Jaw, it is a signal that the downtrend will continue.
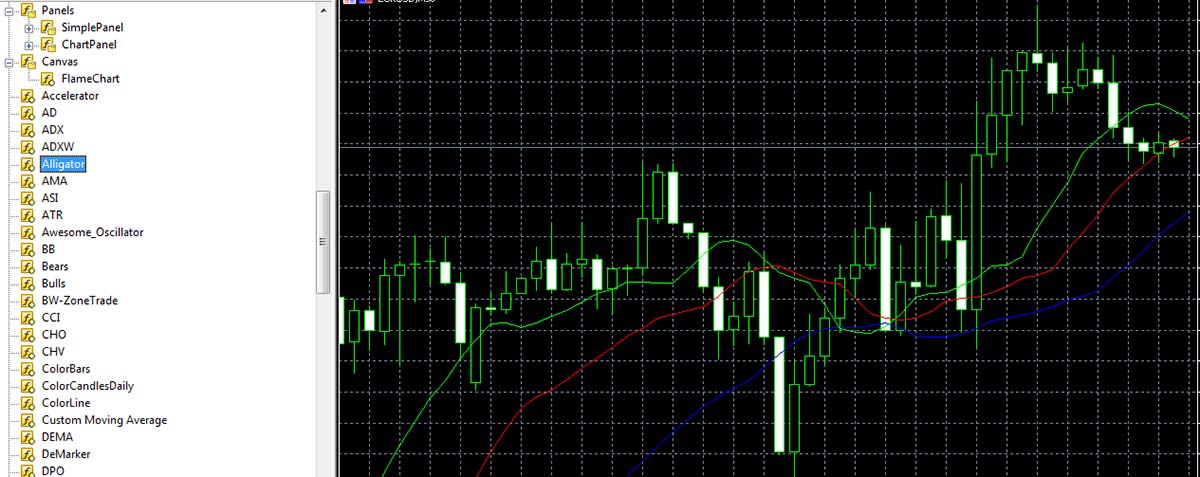
Image 20
When all the slides, i.e. parts of the Alligator, are intertwined, it is, according to Williams, called “The Alligator is sleeping”, which essentially means that the market is in a consolidation phase. The longer the Alligator sleeps, the hungrier it will wake up. And when the Alligator “wakes up”, i.e. when its slips start moving, it signals that a breakthrough in the trading range is imminent – the Alligator is hunting for price. The longer the sleep phase lasts, the stronger is Alligator’s activity after awakening. After its saturation, the Alligator loses interest in hunting, which looks like moving averages convergence, i.e. the indicator signals that the market enters the consolidation stage again.
Compared to the previous two indicators, the Stochastic Oscillator shows more traditional signals and is used much more frequently. Stochastic shows the closing price in relation to the previous range of maximum and minimum prices and is measured as a percentage. It consists of two lines – a fast line (%K), continuous, which shows reversal points and a slow line (%D), dotted, marking the most important of points.
Stochastic shows three types of signals: divergence, stochastic line level, stochastic line direction. Divergence is a divergence of the indicator with the price movement indicators. For example, bearish divergence is marked when D is above 80 and forms two peaks, while the price keeps growing. Conversely, a bullish divergence can occur when D is below 20 and forms a double rising base, while prices are falling. Signals to buy are when stochastics K or D are nearing 20 and rising and K is rising above the D line. Sell signals, respectively, are noted when the Stochastic rises above 80 and falls, or when the K line falls below the D line.
Momentum is another traditional oscillator, showing the strength of the trend. The indicator can work ahead and is most effective in long term trading. The Momentum curve is located underneath the price chart and it moves, oscillating between -100 and +100. When the curve line crosses the 100 level from bottom to top, it signals an uptrend, traders are prepared to buy; a downtrend is defined by crossing the 100 level from top to bottom, traders can open sell orders.
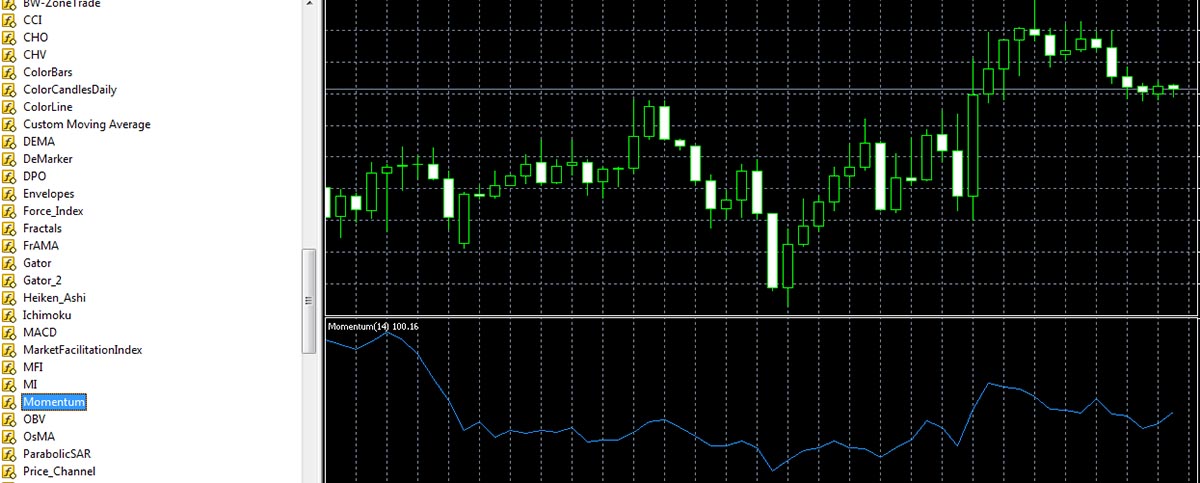
Image 21
Momentum gives fairly accurate divergence signals. For example, when prices reach a peak and after a short decline a higher peak, but Momentum does not reach a new peak, which serves as a signal to sell, after the decline of Momentum. Optimally in this case, the Momentum signal confirms the Stochastic signal.
The indicator “Bollinger Bands” is designed to determine the extremums and is optimal for determining the point of entry into trading on a clear trend. That is, it is more suitable for working in a volatile market. With the help of the indicator you can try to determine how high or low the price of the asset to the moving average over a certain period of time, which, in turn, allows you to give a forecast for the growth or decline in price. The central bar of the indicator is actually the moving average of the price, the upper and lower bars show the price level to the moving average. Thus, when the price reaches the upper Bollinger band, the asset is overbought, if the lower band – the asset is oversold. On this basis, the trader can decide on further action, given that these price movements themselves do not necessarily indicate a trend reversal. That is, the Bollinger Band indicator should be complemented by another indicator.
The distance between the bars also gives certain information about the market. A large distance between the upper and lower bands confirms high volatility, a small distance indicates low volatility. As a rule, 20 periods are specified in the indicator settings on the terminal. If the periods, i.e. candlesticks, are smaller, the indicator will react to price changes faster, but at the same time, the number of false signals will increase. If the period is longer, the indicator reacts slower, but its indicators are more reliable.
Atypical non-brended indicator Detrended Price Oscillator is valued by many traders quite highly as an additional indicator, because it helps to effectively track small movements – pullbacks and corrections on short-term frames. Therefore, in spite of its non-standard nature, it is integrated into trading platforms. It is not recommended to use it as the main one, as it is clearly lagging. The oscillator is a curve of closing prices and a moving average, which acts as a zero line. When setting up the Detrended Price Oscillator in the terminal, you specify two parameters – the moving average and the number of last bars for calculations. At the same time, the indicator always gives a significant number of false signals.
So, the Detrended Price Oscillator generates fairly simple and clear signals: if the chart lines up above the zero mark, then an uptrend is formed, it can be a signal to buy. If below the zero mark, it indicates a downtrend and is a signal for a possible sale. But these signals require confirmation by other indicators.
More significant signals – if the zero level is broken through from below and this is accompanied by a similar price movement, this is a signal to buy, if the zero level is crossed from above together with the price, this is a signal to sell. But these signals also require confirmation by other indicators.
Conclusions
The number of indicators for forex trading is huge, but the basic, most commonly used and proven effective, probably no more than a hundred. Of these, a few dozen are consistently in demand.
All indicators, whose usefulness has been proven over time, are integrated into the trading terminals. The most detailed methodology of application is developed for them, there is a description of all the subtleties of working with them, all the disadvantages and all the advantages, as well as the most effective combinations of indicators among themselves, in the Internet. Nevertheless, none of these indicators does not guarantee the profitability of trading.
When loading the indicator on the chart, the trader must clearly understand why he needs this indicator and be able to work with it, only then the indicator will be useful. It is necessary to fully understand the principle of information display by the indicator, in which conditions it is useful and in which it can lead to losses. Before you apply an indicator to a real account, you should test it on a demo account.
As for custom indicators, they copy the already known indicators in their functionality, they may be more useful in certain conditions, but in general, their effectiveness is not higher than the standard ones. To prevent the use of custom indicators from causing more harm than good, it is necessary to know well how the standard indicators work. Third-party indicators loaded on the chart should definitely be tested for rewriting.
The main trading terminals are MetaTrader 4, MetaTrader 5, cTrader, they are used by most traders, the most popular terminal is MT4. The same terminals are presented by the overwhelming majority of brokers. For MT4 there is the greatest number of explanatory materials about indicators.
One of the old brokers with a long history, but contradictory reviews in the forex sector. Provides brokers the opportunity to trade on the terminal with MetaTrader, on the desktop and web version of HY Trader, developed by MetaQuotes Software Corporation. Quite extensive analytics – news, Trading Central (Recognia) analytics, daily market reviews, weekly currency reviews, provides trading signals when using certain accounts, video tutorials and so on.
- Fibo Group (website: https://www.fibo-forex.org/)
International broker, provides the opportunity to trade on terminals MetaTrader 4, MetaTrader 5 and cTrader. There is quite a lot of educational information, a large analytical section, automatic trading, a set of signals from MT4, explanations of the indicators within the training.
A very large and very active forex broker, offers traders trading on MetaTrader4, MetaTrader5, MT4 both in desktop and web versions. MT4 also has an MT4 Supreme Edition brokerage extension, Signal Manager.
As you can see, most major brokers offer traders MT4 platform for trading, less often – MT5 and in third place, apparently, cTrader.
MT4 and MT5 indicators
The MetaTrader4 platform offers a large selection of indicators, probably the largest number of indicators among all platforms, taking into account custom indicators, and developed the largest number of methods of their application. Also MT4 is most often used by forex brokers.
The OBV indicator, – balance volume, – is one of the simple indicators, which can be leading. It is visualized on the chart as a broken line, confirming the trend direction. The indicator is calculated by the closing price of the current bar – if the price is higher, the value of the bar is added to the previous value; if the closing price is lower than the previous bar, the volume is subtracted from the previous value of volume. It is considered that volume changes precede price changes and trend formation.
Popular MT4 indicators include MFI – The Money Flow Index, which characterizes market behavior after a change in volume. It acts similarly to the RSI indicator, taking into account, in addition to the moving average indicators, the volume indicators as well. Like the RSI, the values vary from 0 to 100, but the numbers are not as important as the dynamics. Overall, the MFI shows how interesting the currency is during the trading period. The indicators are located to the left of the trading charts in the corresponding folder.
Image. 4
How to add an indicator to MetaTrader4 chart?
To run the indicator, you need to select the appropriate one from the list provided, for example, Adaptive Moving Averageand click on the folder with the indicator.
Image. 5
In the center of the terminal interface there will be a window where you need to set the necessary parameters: periods of fast and slow EMA, levels, timeframe and others. After selecting the parameters, press the “OK” button and the indicator will appear on the chart.
Image. 6
You can view the list of indicators in the chart, change the indicator parameters or delete it by pointing the mouse cursor to it and right-clicking, causing a menu.
Image. 8
The oscillators are set in the same way. The oscillators are displayed below the graph.
_
What to do if the platform does not have the right indicator?
Custom indicators written in the MQL4 programming language can be downloaded to the MT4 platform. Most of them are free. The process of downloading is not complicated, though, if you go through it several times. Suppose a trader needs an additional indicator for trading. There are a lot of third-party sources of indicators on the Internet, but it is optimal to use indicators provided by the community of traders of MT4 platform itself.
Image. 9
In the list of indicators you can choose, for example, Channel.mq4. Going to the page with the indicator, you can see its rather detailed description and, if you like the indicator, download the zip-archive.
_
After unzipping the zip file, copy the files into the MQL4/Indicators folder in the Data Folder. The Data Catalog is located in the “File” section of the terminal.
_
In the data directory you need to find the appropriate folder, in this case it’s “Indicators” folder, and copy the indicator file into it – it’s a file in .ex4 and/or .mql format. By the way, the file can be in the format .dll, then it is saved in the folder “libraries”.
_
In order to load the indicator on the chart, you need to return to the trading terminal, go to “Tools”, “Settings” tab and in the center of the terminal a window will appear, in which you select the “Expert Advisors” tab, where you fill in the necessary parameters for the trader, press “Ok” button and the trading terminal is reloaded, after which the indicator is installed. In order to use it, you need to enter “Insert” section in the terminal, select “Indicators” section and choose “Custom” in it and select the installed indicator.
Image 13.
After that, in the center of the trading terminal will be a window with the settings of the indicator, the trader selects the desired parameters, presses “Ok” and the indicator appears on the chart.
Metatrader5 also provides a wide range of indicators, both known from MT4 platform and new ones. Popular on MT4 indicators include, for example, the adaptive moving average AMA. This indicator was invented by trader Perry Kaufman to solve two main problems of standard moving average: on small averaging period moving average gives a lot of false signals, and on long period it is too late. The AMA moves more smoothly during a flat period and shows prices more accurately when there is a clear trend.
Image 14
Another popular ADMI indicator, version ADX indicator, an index of the average direction of movement. The indicator is needed to determine the trend, the best time to buy, sell and fix profits. ADMI allows you to determine the trend more correctly. The indicator consists of three lines, displaying, respectively, the growth of price, falling prices and the trend.
Image 15
Envelopes indicator is considered a highly accurate indicator that helps beginning traders learn to determine the trend direction. It is constructed of two trend lines, the horizontal position of which indicates a flat, while sharp changes show where the trend is headed.
Image 16
EMA indicator is an exponential moving average, also often used on MT5, as well as on MT4. The purpose of EMA – to reduce the lag of signals, which is achieved by the method of price calculation, which takes into account the value of the price of the previous trading session.
One of the popular indicators of recent times, FRAMA, the Fractal Adaptive Moving Average. The action of the indicator is based on the fractal theory of financial markets, which states that modern price movements depend on past price movements and that price movements within one interval are similar to price movements in another interval. The FRAMA indicator detects the fractal dependence of price on different intervals and calculates the smoothing coefficient of the EMA. FRAMA more clearly follows strong trends and also clearly slows down during consolidation.
Loading of standard indicators on the MT5 chart is similar to MT4. In the MT5 web terminal it is possible to download from the Market of the terminal.
Image 17
After downloading from the Market, the indicator is loaded into the desktop terminal as follows: “Insert” → “Indicators” → “Custom” → Indicator.
MT5 Market is a full-fledged online store, where you can also get free indicators. But you can choose them not only by price, but also by indicator type, reviews, rating, popularity and other parameters. But on the site you can act as a developer and seller of indicators.
Third-party indicators on MT5 are installed similarly as on MT4, the only difference is that permission to import DLL files into the terminal is given in the “Expert Advisors” tab, which looks different than on MT4.
Image 18
When choosing and downloading an indicator, especially a third-party indicator, you should not forget about the need to test its functionality on a demo account. You can use MT5 indicators not only for trading on the MT5 terminal, but also when trading on the brokerage trading platforms, if there is no possibility and necessity to set indicators on third-party platforms. In this case it is important for a broker to use the same quotes as MT5. The sources of quotes on Metatrader5 are Integral, Hotspot FX, FastMatch, Currenex, FXCM Pro, LMAX Exchange, Swissquote, Alpari.
Forex indicators that you need to know
In addition to the previously listed several basic indicators, it is desirable and even necessary for a trader to know a few more tools and be able to apply them in practice. Let us briefly list them.
Trend indicators
The simple moving average, the basis of technical analysis and the most common indicator. It is standard for any trading floor. This indicator is used to determine the direction of the trend. It represents the arithmetic average of prices, such as closing prices. If the line is directed upwards, the price rises; if the line is directed downwards, the price falls. SMA is suitable for any timeframe, for any currency pair, the user can introduce the individual parameters of the indicator. For an experienced trader to understand the market situation, this line alone is sufficient, while beginners require additional indicators to clarify the indicators.
WMA, Weighted Moving Average. This indicator is aimed at solving the same problems as similar moving indicators – it smoothes the display of price on the chart, eliminating noise, which allows you to more clearly visualize the trend direction and predict the further price dynamics. When calculating the indicator, the end price of a certain period is taken and an average of several such indicators is calculated. Among all moving averages this indicator is the fastest. WMA shows the change of trend when the price crosses the line. However, it is considered optimal to use other indicators to confirm the WMA signals.
The ZigZag indicator is a standard indicator that connects local lows and highs to cut off price noise, it also allows you to identify trend reversals. It represents straight lines, which are placed accordingly to a significant price change. ZigZag is an additional indicator, the indicator itself does not allow predicting anything. The ZigZag indicator is more suitable for situation analysis than for trading, because it lags a lot, but it defines price movements very accurately and facilitates the determination of resistance and support lines and the determination of graphical patterns.
Parabolic is an indicator, also similar to a moving average. It allows you to determine the direction of the trend and its change. It looks like a row of points above or below the price. If the price is above this row of dots then the trend is upward, if the price is below the indicator then the trend is downward. This means that Parabolic SAR can function as support and resistance lines. SAR is “Stop and Reverse”, that is, the indicator shows a change of trend, the point or bar at which the parabolic begins to move is often a reversal. At the same time, the indicator works optimally only with pronounced trends on the market.
The Aroon indicator is designed to determine the trend and local highs and lows. It is essentially a set of indicators that includes what is known as the Upper Arun, which shows how many days have passed from the beginning of the time period being tracked to the high; the Lower Arun, which shows how many days have passed from the beginning of the time period being tracked to the low; and the Arun Oscillator, which shows the difference between the Upper Arun and the Lower Arun. It is said that if the Upper Arun crosses below 50, the uptrend has dried up. If the same mark is crossed by Lower Arun, the downward trend is exhausted. In situations where Aruns cross 70, each for its own case, the corresponding trend is increasing.
- Ichimoku Cloud
Ishimoku indicator allows you to determine the market trend, support levels and resistance levels and clarify buy and sell signals. The Ishimoku indicator is quite complex, it consists of five lines:
- Tenkan-sen – the average value of the price for a certain first period of time (maximum plus minimum divided by two);
- Kijun-sen – the average value of the price for the second period of time;
- Senkou Span A is the middle of the distance between Tenkan-sen and Kijun-sen, shifted forward by a value equal to the second time period;
- Senkou Span – the average value of the price for the third time period, shifted forward by the value also of the second time period.
- Chinkou Span – the closing price of the current candle, shifted backwards by the second time period.
Oscillators
- Sentiment
Sentiment is designed to determine who dominates the market, bulls or bears. The indicator is presented in the form of a line, which moves from the zero mark. Accordingly, if the line is above zero and leads upwards, the market is dominated by bulls, if the line is below zero mark, the market is dominated by bears. The Sentiment in the form of a histogram consists of bars of 4 colors, each of which indicates a certain market sentiment. Despite the fact that the oscillator’s main task is to display the sentiment, it also allows you to determine the entry and exit points of the trades.
The DeMarker oscillator is designed to determine price depletion zones, in which extrema are most likely to occur. It is quite effective in the period of changing trends and in determining the intraday market entry and exit points. The Demark indicator ranges from 0 to 1, if the indicator value is around 0.7, it can signal a decline in price, if less than 0.3, it can signal a possible rise in price.
Bulls Power and Bears power indicators are designed to determine the strength of “bulls” or “bears” in the market. The indicators are based on a moving average, which represents the conditional balance between sellers-bears and buyers-bulls during a certain period of time. The maximum price reflects the maximum strength of bulls, while the minimum price reflects the maximum strength of bears. Accordingly, Bear Power is the difference between the minimum price and EMA, usually 13-period, and Bulls Power is the difference between the maximum price and EMA, also 13-period.
The Williams %R indicator is designed to determine overbought and oversold, it functions similarly to Stochastic. The indicator shows the level of closing price in relation to the range of extremums for a certain period of time. The indicator is situated in a certain corridor and varies from 0 to -100. If the indicator has a value around -20, then it is overbought, if it is around -80, then the price of the asset is underbought. The indicator does not predict the future, but based on the fact that the asset is overbought, then its price will soon begin to fall, if it is underbought, then the price is likely to decrease.
The CCI is a trading channel oscillator, which shows the deviation of the instrument price from the moving average. If the index is high, it means that the price is overvalued, if the index is low, the price is undervalued. That is, the oscillator can show overbought and oversold levels, which allows you to detect a trend reversal. The oscillator oscillator is visually a line ranging from -300 to +300, though values of the oscillator can be out of these limits. When the bulls dominate, the line moves near +100 and when the bears dominate, it moves near -100. Lines outside these limits are considered as indicative of the beginning of a reversal.
- Rate Of Change
Rate Of Change or RoC is one of the simple oscillators, which shows the rate of price change over a certain period of time, which allows you to understand the direction of the market. If the indicator rises, it indicates an optimistic mood of traders and growth of market activity. If the indicator decreases, it indicates the fading of activity and negative mood of traders. On this basis, the indicator can function as a leading indicator showing the trend change in advance. The basis of indicator calculation is comparison of the current closing price with earlier indicators. It is characterized by high efficiency in forecasting major market trends.
- Detrended Price Oscillator
The Detrended Price Oscillator is one of the not quite standard indicators. It is designed to determine oversold and overbought, without taking the trend into account. It is noted its effective work on short-term trading cycles.
The trend oscillator is the so-called “Average Directional Movement Index”. It consists of three lines: ADX; “+DMI” line; “-DMI” line. The indicator determines only the strength of the trend with indicators from 0 to 100. The index values less than 20 show that the trend is weak, and 20 to 50 that it is gaining strength. This oscillator does not give signals to buy or sell, it only stimulates the trader to make a decision, showing the stability of the trend.
Bill Williams Indicators
- Alligator
The Alligator indicator is one of the Williams indicators. It consists of three moving average lines with different periods. Each of the lines has a characteristic conventional name. Alligator’s jaw is a 13-period moving average, shifted forward by 8 bars. The second moving average is called Alligator’s Teeth and is an 8-period moving average, shifted 5 bars into the future. The third moving average is called Alligator’s Lips, a 5-period smoothed moving average, shifted by 3 bars. The moment of crossing of all lines shows the consolidation phase. The indicator helps to determine the signal to enter the market and to clarify the direction and strength of the trend.
Another one of Williams’ oscillators, which is an addition to the Alligator indicator, is not used as an independent indicator and is not popular at all, precisely because there are enough complications with one Alligator. The indicator is based on the values of moving averages and shows the trend direction and strength similar to the Alligator, but in a different format.
The Gator consists of two histograms of different colors on either side of the zero line. The color, location from the zero line and the value of the bars in the histogram indicate a trend or its absence. For example, if price values decrease, the histogram is red, if prices increase, it becomes green.
The “Miracle Oscillator” is also Williams’ brainchild. In fact, this oscillator is identical to the classical MACD indicator and is designed for presenting trend reversal signals. But MACD is based on closing prices, Awesome Oscillator is based on median prices and can act as a leading indicator.
Indicator signals
The most important skill for a trader who trades on indicators is to correctly recognize accurate indicator signals, cutting out false ones. Signals come in different forms, for example, many indicators are placed directly on the chart and give signals in the form of arrows, changes in the direction of the curve or change color.
Oscillators, placed below the window of the trading terminal, show the curve, the values of which must be correlated with the price fluctuations displayed on the chart, that is, the signals are not specially indicated, they must be seen by the trader.
The more professional an indicator is, the less definite signals it gives. Professional indicators are used for analyzing the market situation, on the basis of these indicators a trader determines the point of entering or exiting the trading and makes decisions about the actions during the trading. That is, such signals do not do the trader’s work, but only help him.
Indicators that give unambiguous signals and do not allow for complex interpretations are designed for novice traders. At best, the trader must be able to distinguish more or less clearly a true signal from a false one and determine the strength of the signal. But there are simple indicators that give direct instructions to buy or sell. The problem with such indicators is that they are inevitably wrong. The trader, who is aimed at long-term serious work on the market, simple indicators help to pass the very first stage of work.
A significant problem with indicators is redrawing: when you reload the trading terminal, the same indicator gives different, sometimes cardinally opposite signals. For example, before reloading there seemed to be signals of trend change from upward to downward and the trader made a sell bet, but after reloading it turns out that there was no reversal. The same can happen without reloading, but in a situation when the indicator seems to have detected and corrected an “error”. Such an indicator leads to losses when trading in real time, but if you look at its history, it turns out that it is almost perfect – there is a “rewriting of history” in the literal sense of the word.
Overdrawing indicators are dangerous to the trader, so you should read the reviews of indicators and test any indicator before using it. Testing is performed in several stages. The first stage – the indicator is run in the terminal, the trader watches its work for several days. During this time there should not be any obvious signal re-drawing to the opposite.
If this stage is passed, the trader moves on to the second stage of verification. For checking, a period of time is selected and all the signals are somehow copied – recorded or a screenshot is made, etc. The terminal is reloaded, the indicator is launched again and its values – for the marked period of time – are compared with the signals that were marked after the reload. If the signals have changed, this indicator is not suitable for use.
If the vast majority of signals remain in place after checking, then the second stage of the test can be considered successful. Next you need to check the accuracy of the signals, initially on a demo account.
Examples of forex indicator signals
Let’s look at what signals some popular indicators give. For example, the forex oscillator RSI, Relative Strength Index, is a curve and provides the following signals: RSI above level 50 promises an uptrend, below 50, respectively, the downtrend. When the RSI crosses 50, the market is overbought. If it crosses 30 on the downtrend, the market is over-sold.
The reversal levels are 70 for trend change to downtrend and 30 for trend change to uptrend. Also a trend change is indicated by interruption of the RSI and a mismatch of the Index with the price chart.
The MACD indicator functions in two versions, in the form of lines and a histogram. In the linear version, two lines are drawn – a solid main line and a dashed line, which is often highlighted in color. The main line shows the average price fluctuation and quickly reacts to the price change, the dashed line reacts slower, but estimates a longer time interval. When the signal line crosses the main line in the upward direction, a buy trade can be opened. If the signal line crosses the main line from top to bottom, this, respectively, is a signal to sell.
The position itself is also a signal for the trader. For example, if the main line is located above the signal line, then the market is dominated by bulls, if the signal line is located above the main line, then bears dominate.
The histogram version of the MACD shows the same information, but visualized differently – as bars above and below the zero mark. It is obvious that if each next bar is higher than the previous one, the market trend is ascending, if each bar is lower than the previous one, the market trend is descending. It is clear that when a column with the opposite value appears on the histogram among the columns of a certain trend, the trend can change accordingly.
The RSI and MACD signals are fairly easy to interpret. But not all indicators are that clear. Let’s consider the signals of one of the complex indicators – the Ishimoku. In general, the Ishimoku signals can be divided into just three parts:
- Signals on Senkou Span A and Senkou Span B lines and “crosses”;
- Signals on the Chinkou Span lines;
- Signals on the price chart lines and lines.
Image 19
For example, crossing the line Tenkan-sen and Kijun-sen from bottom to top is called a “Golden Cross” and signals an opportunity to buy, crossing the line Kijun-sen Tenkan-sen is called a “Dead Cross” and signals an opportunity to sell.
The Chinkou Span line displays the current price shifted by a certain number of periods, and prices of previous periods are resistance and support levels. If the Chinkou Span line touches the line in the direction from above, it signals that a downtrend is forming. If the Chinkou Span breaks the price line from below, an uptrend is forming. Clear reversal signals of the Chinkou Span are considered to be very effective.
Senkou Span A and Senkou Span B lines limit the possible price indicators, forming a so-called “price cloud” on the chart, which is marked by color depending on the trend. The crossing of the price cloud by the lines indicates the beginning of the change of the trend, which is confirmed by the change of the color of the cloud. The Tenkan-sen line performs functions of a moving average; when prices roll back from extremums the Tenkan-sen line takes the place of the support or resistance line, which may indicate a trend reversal.
On the basis of this indicator it is possible to create full-fledged trading strategies. At the same time, despite the visual complexity, the number of Ishimoku signals is limited, they are formalized enough and can be memorized and learned to recognize quickly enough.
The signals of Bill Williams’ indicators are peculiar. The alligator, to which Williams has given the maximum resemblance to the zoological prototype in appearance and behavior, having created a peculiar language, which should be understood when mastering the indicator. Alligator consists of three moving averages with different periods. “Alligator’s Jaw” marks the long-term price, Williams also called it the “Balance Line”. If the price is above the Alligator’s Jaw, it is a signal for an uptrend to continue. If the price is below the Alligator’s Jaw, it is a signal that the downtrend will continue.
Image 20
When all the slides, i.e. parts of the Alligator, are intertwined, it is, according to Williams, called “The Alligator is sleeping”, which essentially means that the market is in a consolidation phase. The longer the Alligator sleeps, the hungrier it will wake up. And when the Alligator “wakes up”, i.e. when its slips start moving, it signals that a breakthrough in the trading range is imminent – the Alligator is hunting for price. The longer the sleep phase lasts, the stronger is Alligator’s activity after awakening. After its saturation, the Alligator loses interest in hunting, which looks like moving averages convergence, i.e. the indicator signals that the market enters the consolidation stage again.
Compared to the previous two indicators, the Stochastic Oscillator shows more traditional signals and is used much more frequently. Stochastic shows the closing price in relation to the previous range of maximum and minimum prices and is measured as a percentage. It consists of two lines – a fast line (%K), continuous, which shows reversal points and a slow line (%D), dotted, marking the most important of points.
Stochastic shows three types of signals: divergence, stochastic line level, stochastic line direction. Divergence is a divergence of the indicator with the price movement indicators. For example, bearish divergence is marked when D is above 80 and forms two peaks, while the price keeps growing. Conversely, a bullish divergence can occur when D is below 20 and forms a double rising base, while prices are falling. Signals to buy are when stochastics K or D are nearing 20 and rising and K is rising above the D line. Sell signals, respectively, are noted when the Stochastic rises above 80 and falls, or when the K line falls below the D line.
Momentum is another traditional oscillator, showing the strength of the trend. The indicator can work ahead and is most effective in long term trading. The Momentum curve is located underneath the price chart and it moves, oscillating between -100 and +100. When the curve line crosses the 100 level from bottom to top, it signals an uptrend, traders are prepared to buy; a downtrend is defined by crossing the 100 level from top to bottom, traders can open sell orders.
Image 21
Momentum gives fairly accurate divergence signals. For example, when prices reach a peak and after a short decline a higher peak, but Momentum does not reach a new peak, which serves as a signal to sell, after the decline of Momentum. Optimally in this case, the Momentum signal confirms the Stochastic signal.
The indicator “Bollinger Bands” is designed to determine the extremums and is optimal for determining the point of entry into trading on a clear trend. That is, it is more suitable for working in a volatile market. With the help of the indicator you can try to determine how high or low the price of the asset to the moving average over a certain period of time, which, in turn, allows you to give a forecast for the growth or decline in price. The central bar of the indicator is actually the moving average of the price, the upper and lower bars show the price level to the moving average. Thus, when the price reaches the upper Bollinger band, the asset is overbought, if the lower band – the asset is oversold. On this basis, the trader can decide on further action, given that these price movements themselves do not necessarily indicate a trend reversal. That is, the Bollinger Band indicator should be complemented by another indicator.
The distance between the bars also gives certain information about the market. A large distance between the upper and lower bands confirms high volatility, a small distance indicates low volatility. As a rule, 20 periods are specified in the indicator settings on the terminal. If the periods, i.e. candlesticks, are smaller, the indicator will react to price changes faster, but at the same time, the number of false signals will increase. If the period is longer, the indicator reacts slower, but its indicators are more reliable.
Atypical non-brended indicator Detrended Price Oscillator is valued by many traders quite highly as an additional indicator, because it helps to effectively track small movements – pullbacks and corrections on short-term frames. Therefore, in spite of its non-standard nature, it is integrated into trading platforms. It is not recommended to use it as the main one, as it is clearly lagging. The oscillator is a curve of closing prices and a moving average, which acts as a zero line. When setting up the Detrended Price Oscillator in the terminal, you specify two parameters – the moving average and the number of last bars for calculations. At the same time, the indicator always gives a significant number of false signals.
So, the Detrended Price Oscillator generates fairly simple and clear signals: if the chart lines up above the zero mark, then an uptrend is formed, it can be a signal to buy. If below the zero mark, it indicates a downtrend and is a signal for a possible sale. But these signals require confirmation by other indicators.
More significant signals – if the zero level is broken through from below and this is accompanied by a similar price movement, this is a signal to buy, if the zero level is crossed from above together with the price, this is a signal to sell. But these signals also require confirmation by other indicators.
Conclusions
The number of indicators for forex trading is huge, but the basic, most commonly used and proven effective, probably no more than a hundred. Of these, a few dozen are consistently in demand.
All indicators, whose usefulness has been proven over time, are integrated into the trading terminals. The most detailed methodology of application is developed for them, there is a description of all the subtleties of working with them, all the disadvantages and all the advantages, as well as the most effective combinations of indicators among themselves, in the Internet. Nevertheless, none of these indicators does not guarantee the profitability of trading.
When loading the indicator on the chart, the trader must clearly understand why he needs this indicator and be able to work with it, only then the indicator will be useful. It is necessary to fully understand the principle of information display by the indicator, in which conditions it is useful and in which it can lead to losses. Before you apply an indicator to a real account, you should test it on a demo account.
As for custom indicators, they copy the already known indicators in their functionality, they may be more useful in certain conditions, but in general, their effectiveness is not higher than the standard ones. To prevent the use of custom indicators from causing more harm than good, it is necessary to know well how the standard indicators work. Third-party indicators loaded on the chart should definitely be tested for rewriting.
The main trading terminals are MetaTrader 4, MetaTrader 5, cTrader, they are used by most traders, the most popular terminal is MT4. The same terminals are presented by the overwhelming majority of brokers. For MT4 there is the greatest number of explanatory materials about indicators.
Reviews
-
6 December 2020 in 10:04
Great article for “dummies,” there are links for more in-depth study.
-
21 February 2019 in 11:31
And I heard about the forex indicator “iManhattan 3.0”, which is also needed for those involved in trading. Here is its description and review https://profxtrader.ru/forex-indicator-manhattan-3/. It is suitable even for those who have little experience in trading.