Strategy for Online Trading for 5 Minutes “Scope”
Basic technical analysis Using a limited range of products indicators for binary options is possible in many trading terminalsincluding INTRADE.BAR (site). This is a good choice for beginners. More advanced traders prefer to analyze the market on special platforms created for this purpose.
Contents
So, Live Schedule TradingView (website: https://ru.tradingview.com/) supports several thousand indicators of all kinds. Many of the developments are custom, created by enthusiasts. There are quite a few really effective solutions among them. In this article we’ll look at the 5-minute strategy “Scope” based on 2 indicators in a modified version – AK TREND and MACD.
An overview of the “Scope” indicators and strategy
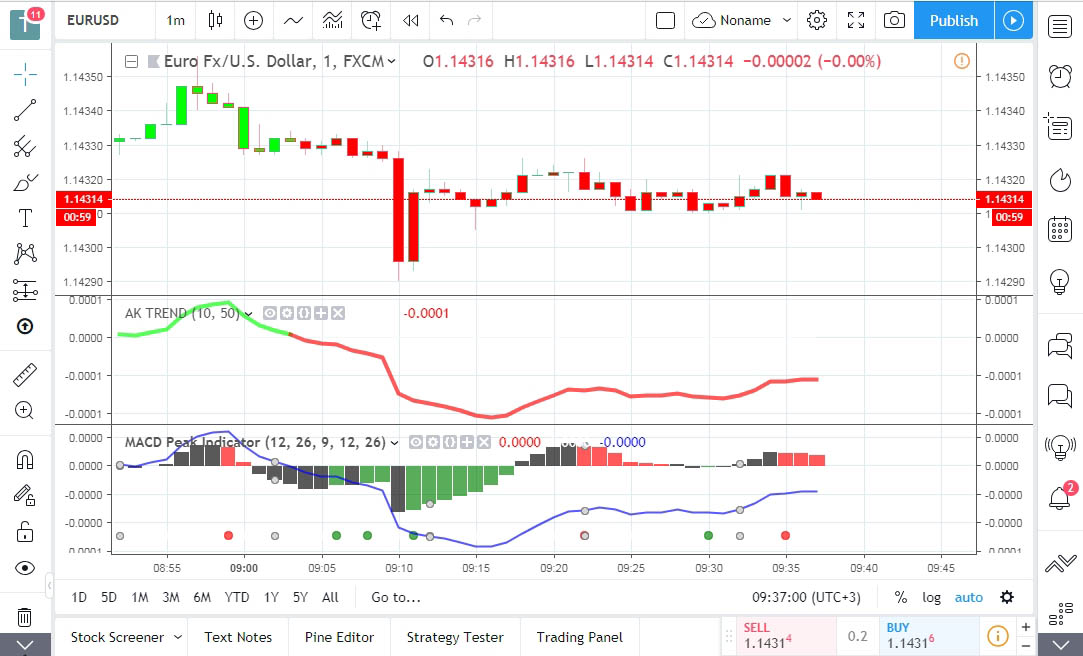
- MACD Peak Indicator – an improved version of the classical version of this indicator. Its difference, firstly, is the presence of an additional line smoothing. Secondly, the difference can be traced purely visually. It consists of one curve instead of two. The main signal – crossing the neutral boundary, which divides the window into two halves, as well as changing the direction of the bars of the histogram. Within the strategy under consideration Binary Options Trading is conducted at the signal of crossing the neutral boundary Moving Average. The appearance of the MACD Peak Indicator is classic – the histogram, which is plotted in a separate window, as well as the curve Moving Average.
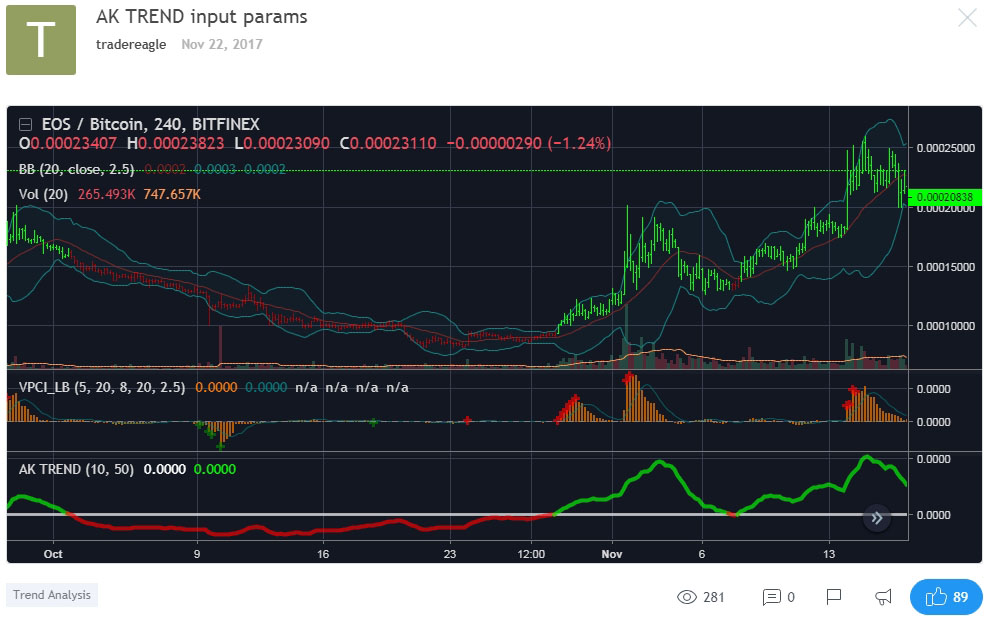
- AK TREND input params – the original version of “AK_TREND” with an additional input parameter, which is indicated in its name. If you look at the formula in the source code, it is easy to see the presence of an additional line with the parameter “adline” equal to zero. Without going into technical details, we can note that the presence of an additional input parameter gives the tool additional functionality. Now it not only moves within the window with gradation from 0% to 100%, but also has a color indication of active phases trend.
The tool consists of a single line, which, depending on the market situation, is colored red or green. The moment of the fill change is a key reversal signal. For the convenience of traders in the parameters of the indicator, there is an additional option, which colors the candles on the chart in red or green. The presence of the fill on the graphic makes it easier to visually identify the prevailing price trend, but actually erases the distinction between upward and downward price bars. A trader who has some experience in trading, it is not difficult to distinguish candles from each other, despite the same color. For beginners it can be difficult, but it does not play a big role (Binary options trading training).
Setting up trading platforms
Technical analysis is performed on the TradingView chart. This is a free service, where the basic functionality is available immediately after registration, it is enough for most traders. You will need to trade on any of the platforms from the rating of reliable companies presented on our website (Binary options brokers rating). The optimal choice is INTRADE.BAR. The company ranks second in the rating, but within this strategies it fits optimally.
For convenience, you can open the trading platform and the live chart for tehanalysis in different browser windows and place them side by side. This is especially convenient on large displays (21 inches and more). But you can also open them in adjacent browser tabs. The time frame of 1 minute does not require such a great speed of reaction, you can manage to switch to another tab, set the desired parameters of the deal and enter the market.
Step-by-step instructions on how to set it up:
- open Live-charts from TradingView in one tab and intrade.bar or another company’s terminal in the other;
- select the same in both tabs trading asset, set up the graphs in the same way: candle mode with a timeframe of 1 minute;
- We add two indicators to the TradingView chart: “AK TREND input params” and “MACD Peak Indicator”;
- adjust the appearance of the MACD by selecting the histogram type “bars”;
- increase the thickness of the line AK TREND input params, this will facilitate the visual perception of the signals.
Trading signals by strategy
The trader should pay attention to three things – the position of the MACD curve relative to the dividing line, the color of the AK TREND curve or chart.
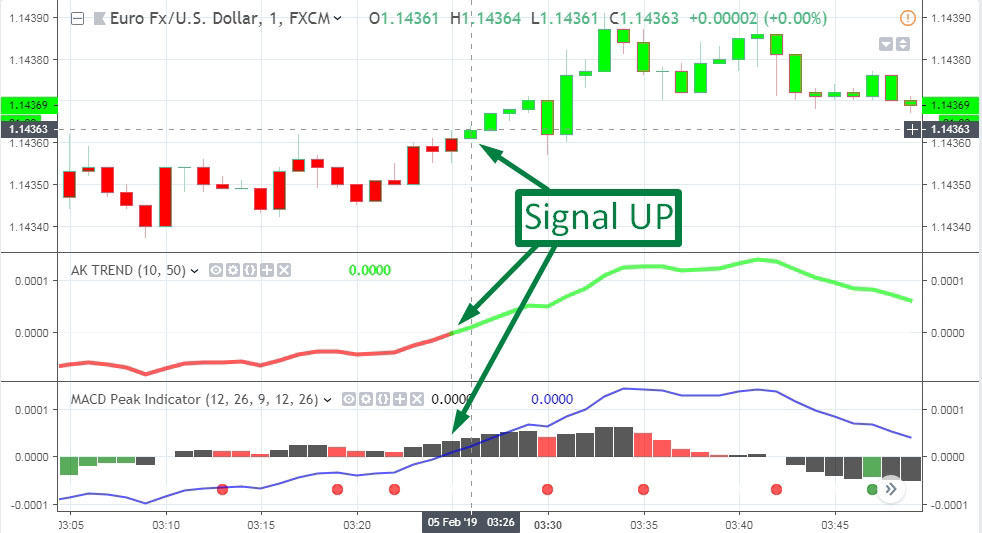
A signal to go up – AK TREND curve and the chart changes color from red to green, and the MACD line goes to the upper half of its window, crossing the horizontal boundary.
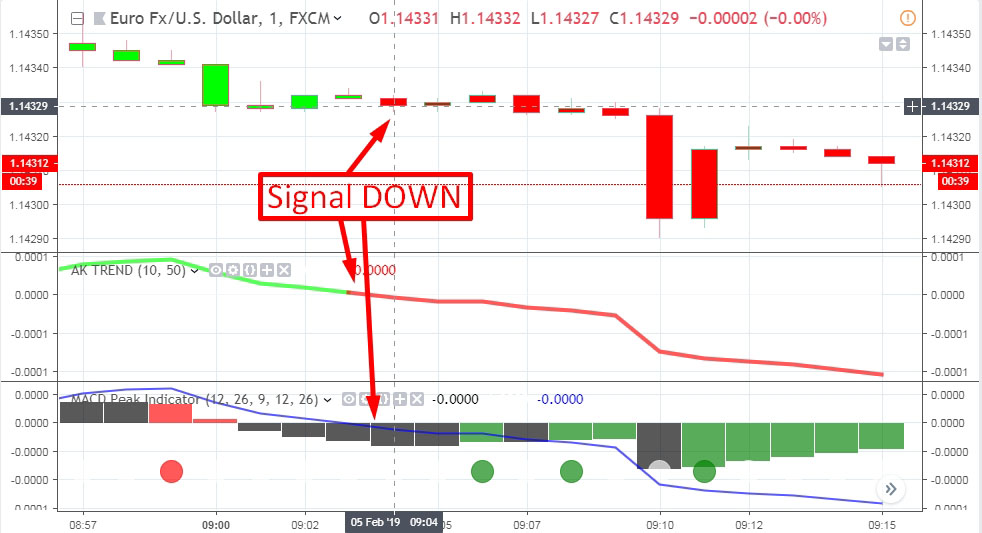
Down signal – MACD transition to the lower position, crossing the border of N/A. Change of chart fill and AK TREND curve from green to red.
The interpretation of signals by the “Scope” strategy is as simple as possible. The green color in trading traditionally means growth and red – decline. Therefore, one should trade based on this principle. There should not be a significant divergence of signals by time. The maximum deviation is 2 candles. If the distance between the signals exceeds this value, it is recommended to refrain from entering the market. The power of the strategy lies in the synchronism of both instruments.


Reviews