The Strategy of Trading 5-Minute Contracts “Regression”
In addition to the standard binary options indicators, used extensively on the stock exchanges and forexThere are many custom developments. The development of the Internet has promoted trading to the masses, which allowed enthusiasts to implement their ideas and share their products with the world community of traders. The most popular international portal for traders is the service TradingView. It is both a forum for exchange players and a market analysis platform, as well as a lot of additional services.
The most popular is “Live Schedule.” TradingView. Its functionality reaches a professional level: thousands of tools are available for technical analysisMost of them are created by enthusiastic traders. In this article we will review strategies “Regression” based on 2 user tools that are very popular in the community for binary options trading.
A brief overview of the indicators
Elastic Volume Weighted Moving Average & Envelope – A solution from one of the community leaders, the user with the nickname “LazyBear”. The indicator looks as simple as possible, it consists of just one line. However it is an effective solution for the analysis, especially when combined with additional filters signals. This is Moving Averagebut it is fundamentally different from conventional solutions of this type. The main input parameter is the trading volume, not the quotes with graphics. The formula evaluates two parameters. First, the standard value of the arithmetic mean of the price for a certain period, set in the settings. Second, the trading volume is taken into account. The curve with the result of calculations is superimposed directly on the chart. It most accurately reflects the situation on the market. That’s why EVWMA_LB is so popular among traders. This development is one of the top 100 most famous custom indicators in TradingView, as well as many other solutions from the developer “LazyBear”.
Linear Regression Slope – Version 2 – This tool has a great resemblance in appearance to the MACD, it also consists of a histogram and a Moving Average. This is a modified version of the main tool for trading on the Linear Regression strategy. The essence of this technique is the construction of a regression price channel, which consists of 2 parallel lines and one median curve. In this combination, they play the role of price support and resistance. In the updated version of the indicator the height of the histogram bars is determined by the coefficient of the actual price deviation from the channel borders. The UCS-LRS of the second version differs with more clarity and simplified view – it is a classical histogram.
Preparing for trading
Strategies using the TradingView platform have an advantage – they are universal. You can trade using their signals on any trading platformwhich maintains the right assets and schedule settings. For beginners the best choice is INTRADE.BAR (site) is one of the leaders in our rating Binary options brokers. Also note the broker Stars Binary (site). The Intrade.Bar terminal supports 50 trading assets and also has 1-minute charts, 5-minute Up/Down trades. You can open the trading platform and the Live chart for tehanalysis in adjacent browser tabs, or place them in separate windows next to each other.
Step-by-step instructions:
- Open the trading platform Intrade.Bar and Live Chart TradingView in different tabs, select a currency pair (for example, EUR / USD) and activate the 1-minute time frame candlestick charts.
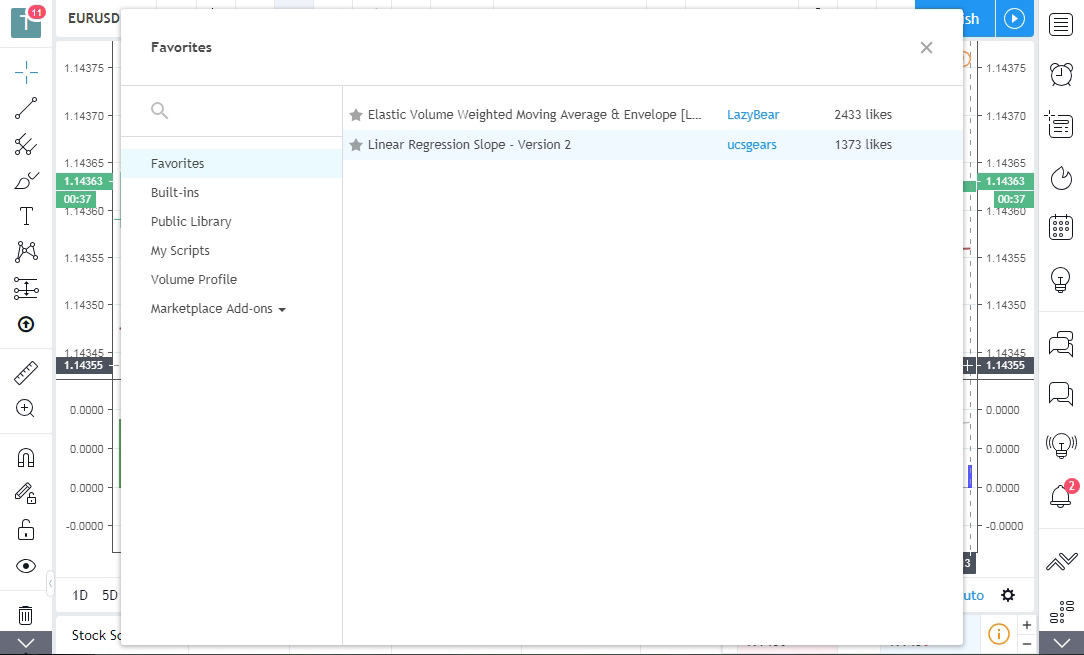
- In the TradingView window add two indicators: “Elastic Volume Weighted Moving Average & Envelope” and “Linear Regression Slope – Version 2”. Do not change the standard settings.
- Determine in advance the amount of investment in transactions by setting this value in the trading terminal. It is recommended – no more than 5% from the current balance of the deposit.
If the trading platform is supported, we also immediately set the 5-minute expiration trades. However, at intrade.bar the duration of contracts is adjusted just before entering the market, and by default the minimum 1-minute interval is set.
Trading signals by strategy
The “Regression” strategy uses unique indicators. They are very effective, but at the same time have a very simple principle of operation. This should not give any illusions to the trader (Binary options trading training). You can make sure of the high efficiency of the strategy by analyzing the signals on the historical data of the Live chart.
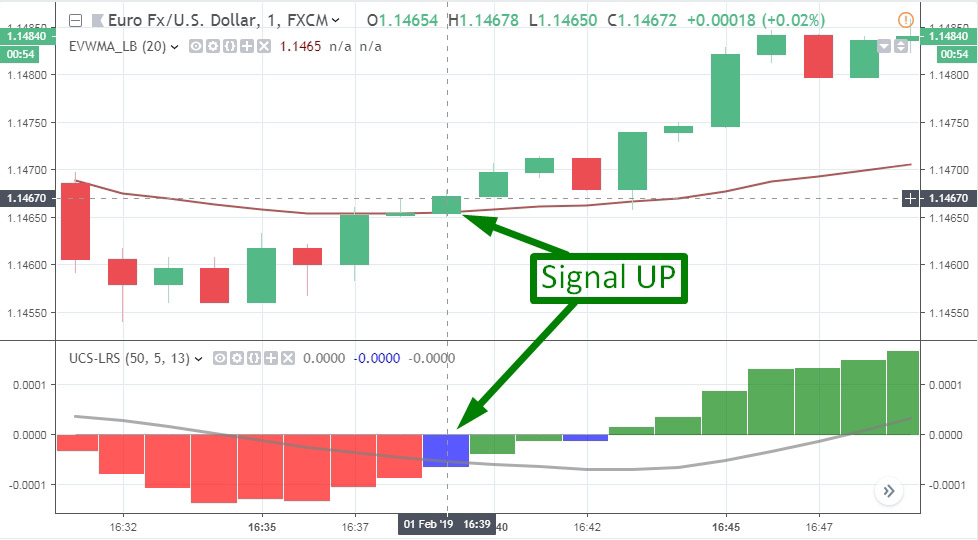
A signal to go up – a blue bar is formed on the histogram, following the red one. The ascending candle overcomes the EVWMA_LB curve, as a result of which the latter moves to a position below the price on the chart.
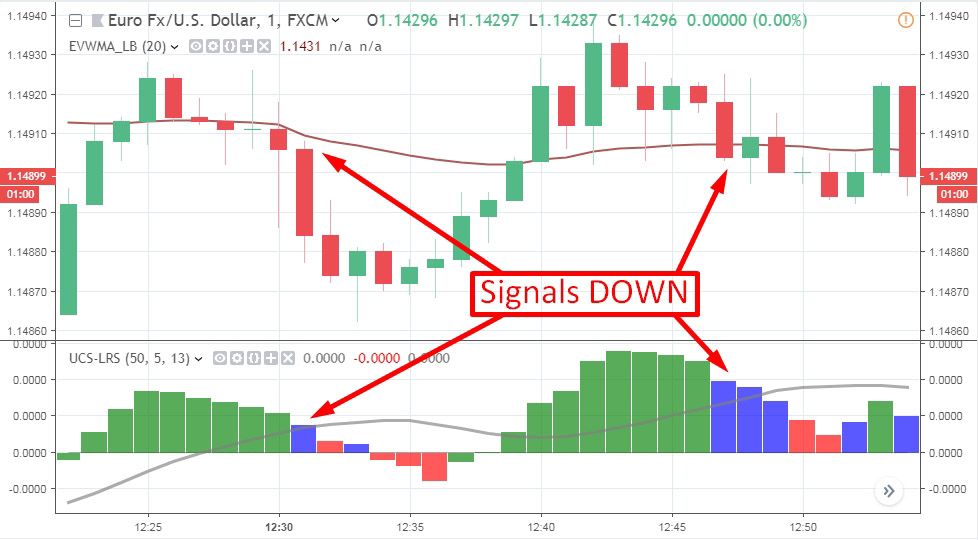
Down signal – formation of a blue bar in the UCS-LRS window after the green bar. On the chart, the descending candle breaks the curve EVWMA_LB.
Entering the market is carried out after both indicators confirm the signal. It is not uncommon to form a certain divergence in time, but it should not exceed 2 minutes. The exception is the situation when, after the breakdown of the curve on the chart, the price is built in close proximity to it. Then the signal from the histogram confirms that the reversal trend The moment to enter the market has not yet been missed. This situation is clearly illustrated in the picture above, which shows examples of downward signals.


Reviews