Parabolic SAR and Bollinger Bands “Punch” Strategy
The basis strategieswhich we will consider in this article are the standard Indicators for Binary OptionsThe trading platforms are very popular with traders. Individually they are even integrated into popular trading platforms, including PocketOption. However, in this system, we will need a custom modification of these popular tools, a hybrid version of them. Therefore technical market analysis will be held at a specialized site from TradingView.
Contents
A brief overview of the indicators
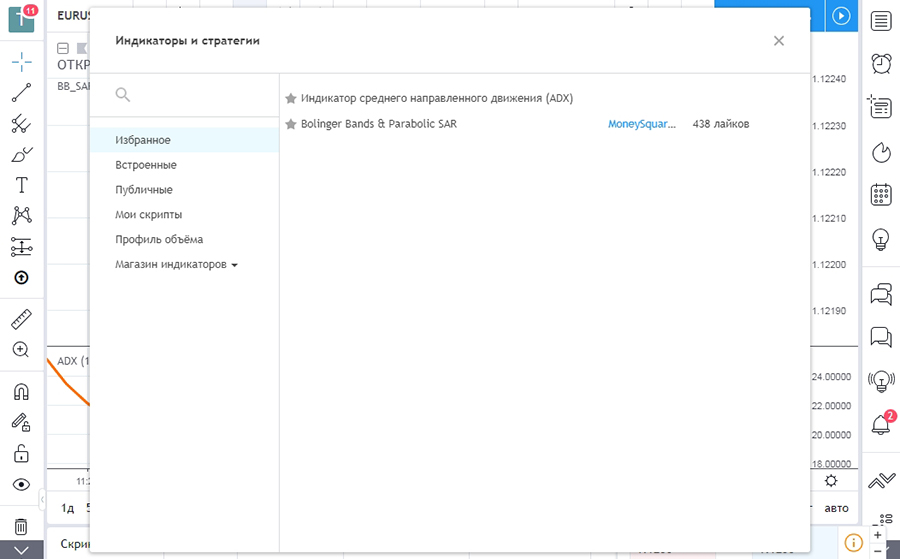
The “Punch” system uses two tools – the Average Directional Movement Indicator (ADX) and a hybrid instrument called “Bollinger Bands & Parabolic SAR”, which includes two Bollinger Bands combined with a Parabolic system. Let’s take a closer look at each of the tools:
- ADX. The Live-charts site presents the original version of this indicator, consisting of 1 curve. The position of the line shows the intensity of the trend on a 100-point scale. A position lower than 15 signals flat, above 15-20 – trend activity, 30 and above – very high market volatility. Higher values of the index are fixed very rarely and are usually short-term.
- Parabolic SAR. The trend indicator, which shows the moment when one trend stops and the opposite market movement starts during the binary options trading. Outwardly, it consists of a sequence of dots that form a broken line.
- Bollinger Bands. One of the leading trend indicators based on Moving averages. John Bollinger used 3 Moving Average curves to form a dynamic price channel, which narrows and widens depending on the strength of the current price trend.
Rules of the strategy
- Trading assets. European and Pacific currency pairs in combination with the dollar or with each other are optimal. These are EUR/USD, GBP/USD, EUR/CAD and others. The best time to trade the dollar and European currencies is from 12:00 to 21:00 MSK.
- Timeframe and Binary Options Expiration. Trading is done on the candlestick interval chart with 1-minute timeframe. Above/Lower turbo contracts with a time frame of 5 minutes are used.
- Money Management. Capital management rules apply regardless of which strategy of tehanalysis is being traded. They allow the trader to save his funds, so they should not be violated. As applied to this strategies you should not invest more than 5% of your balance, it is best if the value of one contract is less than 1% of the deposit.
Preparing to trade on the strategy
Let’s look at the step-by-step instructions on how to prepare for Punch trading. There are only 5 steps, which are standard for such strategies:
- open a web terminal of some platform, for example, at PocketOptionand choose a profitable currency pair;
- in the second tab of the browser open on the graph Live-chart from TradingView the same asset;
- set the candlestick mode and timeframe in 1-minute increments;
- add two indicators: “Bollinger Bands & Parabolic SAR” and the classic “ADX”;
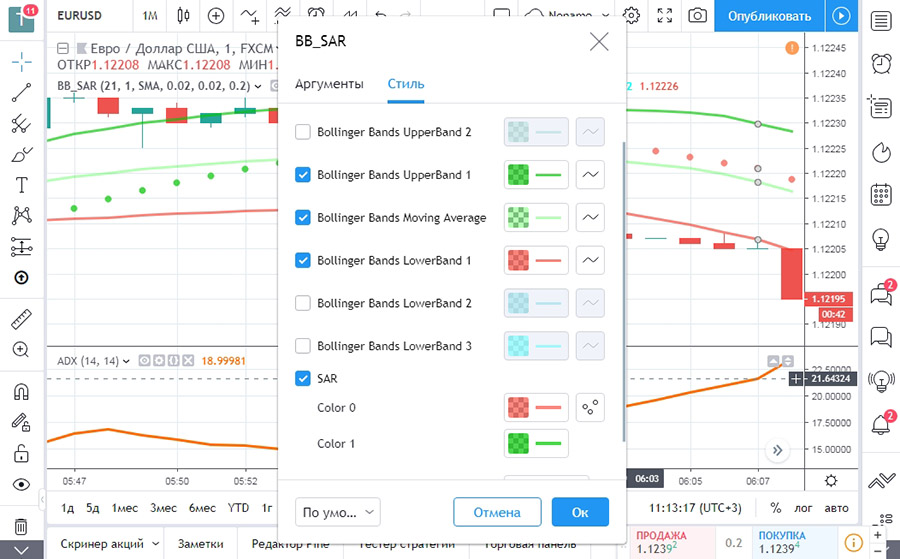
- customize the appearance of the BB & SAR, hiding unnecessary elements and making market analysis tools more visible:
In the parameters, you should hide all the lines except the 3 middle lines and the SAR points. It is also recommended to increase their standard thickness and change the standard color. An example of optimal tool settings is shown in the screenshot above.
Trading signals strategy
The essence of the “Punch” strategy is to recognize the situation when the volatility starts to grow on the background of low market activity. At such moments the SAR points go beyond the Bollinger Bands. The ADX index serves as a non-specific signal filter, it allows to receive confirmation of volatility growth.
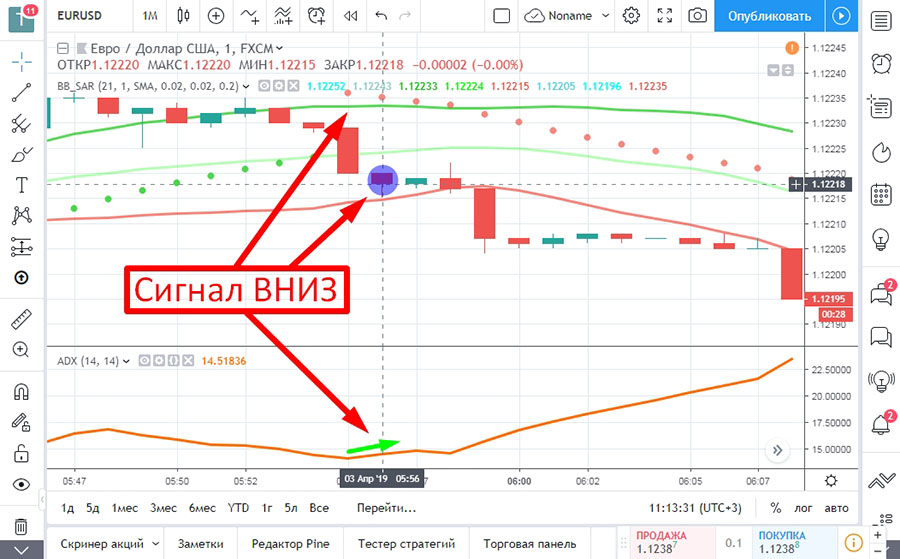
Down signal – on the chart, the descending candlestick must break the middle border of the BB bands and touch the SAR points, and then they move to the top position. Confirmation is the beginning of the growth of the ADX, regardless of its position, the main thing – the presence of a positive trend.
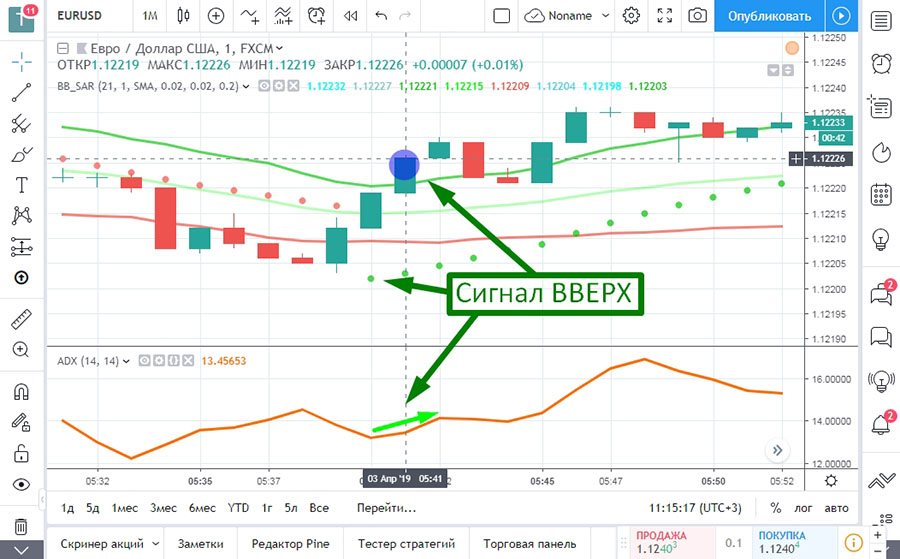
A signal to go up – the upper break of the ascending candlestick of the middle of the BB wave, accompanied by the transition of the SAR points to the position under the price bars. Confirmation is also the beginning of the growth of the ADX curve.
If you trade on pocketoption.com, then you should not forget about the need to manually set the expiration on 5 minutes before each trade is opened. The platforms of some other Binary options brokers also have this feature, it should be taken into account when trading.
Conclusion
Buying a contract to go up or down is carried out after the close of the signal candle, on which all three criteria coincide – the break of the serial SAR line, the breakdown of the middle Bollinger Bands and the growth of the ADX. As for the last criterion – it is nonspecific. Therefore, it is acceptable to enter the market even if it is slowly decreasing or is in a neutral phase. But the signal is considered false when the ADX clearly shows a decline in volatility, ie, his line is directed down.
Reviews