Trading Strategy by CCI Indicator
Traders know that the market is in motion no more than 30% of the total time. The rest of the time activity is relatively weak, a neutral trend prevails. As you know, in the flat the effectiveness of almost all indicators technical analysis. Therefore, in the documentation of the trading strategies It is almost always written that they are suitable for binary trading only in a volatile market.
However, there is a tool that was specifically designed to analyze charts in low price activity conditions – this CCI (Commodity Channel Index) – detailed review of the indicator at InvestMagnates.com. This indicator was added in the next update to the PocketOption platform. So we decided to conduct a detailed review of this tool and give instructions on how to use it in practice.
A little historical background
The CCI was developed about 40 years ago. The fundamental basis of the formula is the theory of wave oscillations. Simply put, if the price goes up in one time period, then in the next interval it will go down. Donald Lambert, the developer of the indicator, is not the author of the theory of cyclic fluctuations of prices, but the formula created by him has shown good efficiency in practice.
The CCI is currently one of the most popular indicators, along with MACD, Bollinger Bands, Alligator, RSI and other legendary instruments. It is one of the top 10, which is why it was added to the range of instruments on the trading platform of the Pocket Option (Registration).
CCI indicator description
The full name of the tool sounds like “Commodity Channel Index”, which reflects the principle of its work. With its help a trader can determine clearly marked boundaries of price channels. In appearance, the CCI is similar to the RSI and Stochastic. It consists of a single line, located in a separate window. It moves within an area with three levels: upper 100, lower -100 and neutral, located in the middle.
The upper and lower boundaries in the indicator window are considered as channel boundaries. As soon as the curve crosses the line 100 – it means that the price has reached the upper level of the corridor, and the breakdown of the line -100 signals the passage of the lower levels of support.
Most often CCI is used as a filter, allowing to determine the optimal entry points with greater accuracy. However, it is also suitable for use as a single tool. The Commodity Channel Index makes it possible to detect trend reversal points earlier than other indicators.
Signals for binary options on the CCI indicator:
- “Up” – entry of the curve into the area below the level of -100 and the subsequent exit from it
- “Down” – entry of the curve into the zone above the level of 100 with a subsequent reversal and exit
It matters how far the curve went after leaving the channel boundaries. If the deviation was minimal – the line crossed the level and immediately returned, it signals about the classical reflection of the price from level of support or resistance. From the trading point of view, this situation is optimal. A significant deviation, when the curve stays in the colored area for a long time, indicates a breakout of the channel boundary. In this situation the accuracy of CCI as an independent indicator decreases.
It is recommended to wait for the formation of a clear price channel and to enter the market at the moment of price reflection from its borders. It is effective to combine the Commodity Channel Index with the graphical analysis. For convenience, you can use autoshapes to draw on the chart. The range of the platform includes Binomo (bonus 100% to deposit by promo code REVIEWEEK100 – Activate) are represented by lines, rays, forks and other graphical tools.
Example of binary options trading on CCI
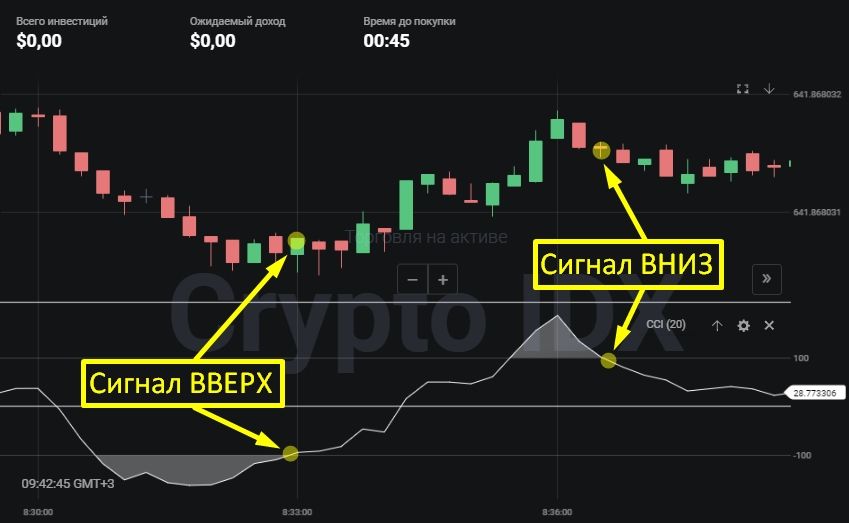
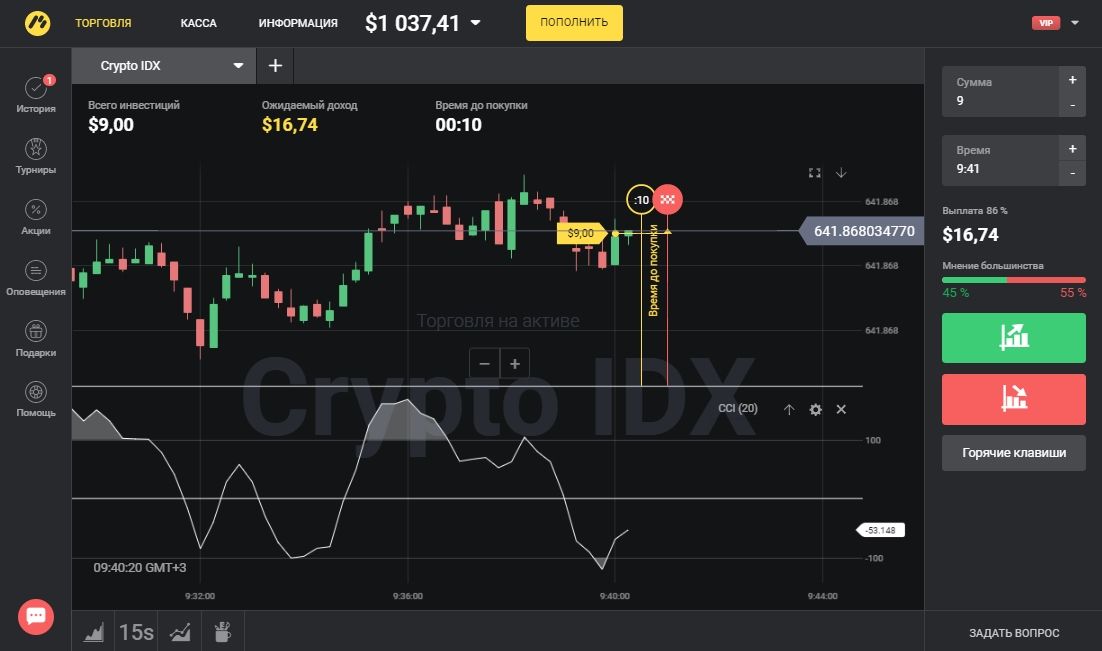
The main advantage of the Commodity Channel Index is the high accuracy of signals under conditions of low market volatility. We will clearly demonstrate it in practice. So, we will trade the asset CRYPTO IDX – it gives the maximum percentage of profit, as well as optimal for technical analysis on the second timeframes. The interval of the chart is 15 sec, expiration – 1 minute, the investment is less than 1% of the deposit.
The above chart shows that the market is relatively calm. There are no pronounced upward or downward trends. In such a situation, conventional indicators such as MACD or Stochastic would show a flat – the curves would practically merge into one line. However, the CCI has a clear and unambiguous signal. As soon as the curve returns from below -100 we open a trade to go up.
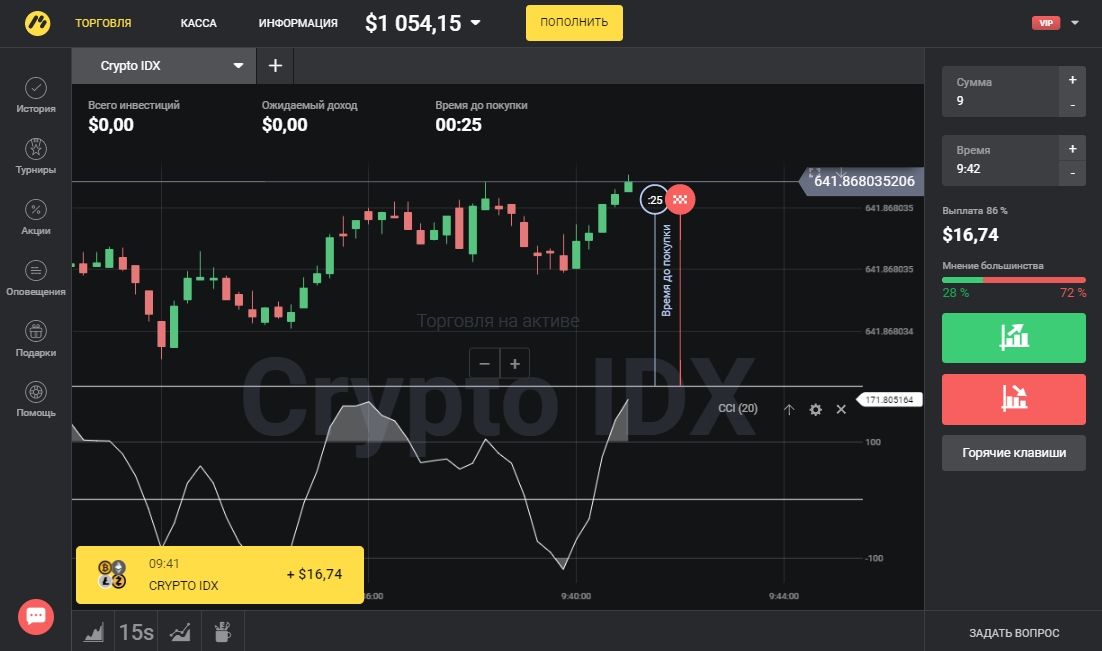
The market volatility is low, so in 1 minute the price reaches the upper limit of the channel. This allows us to make a profit on an open trade. In this situation it is logical to expect a market reversal soon. Therefore, immediately after the return of the indicator curve into the channel limits, it is necessary to buy a down contract.
Money Management
CCI trading should be carried out subject to the standard rules of capital management. First, the size of the investment is important. It is strongly recommended to invest no more than 4-5% of the deposit in one transaction. However, it is better to limit the amount of less than 1% of the deposit. If you use a trading system that allows you to get 65% or more profitable trades, trading in fixed-value contracts allows you to make stable profits.
Conclusion
The CCI will serve as an excellent auxiliary filter in combination with by oscillators or trend indicators. It is advisable to use it when the activity on the market is reduced. The filter will allow to distinguish false triggering of trading systems, typical for the flat period, from the real reversal of short-term trends.
Reviews