Bollinger Waves Indicator. General Concepts
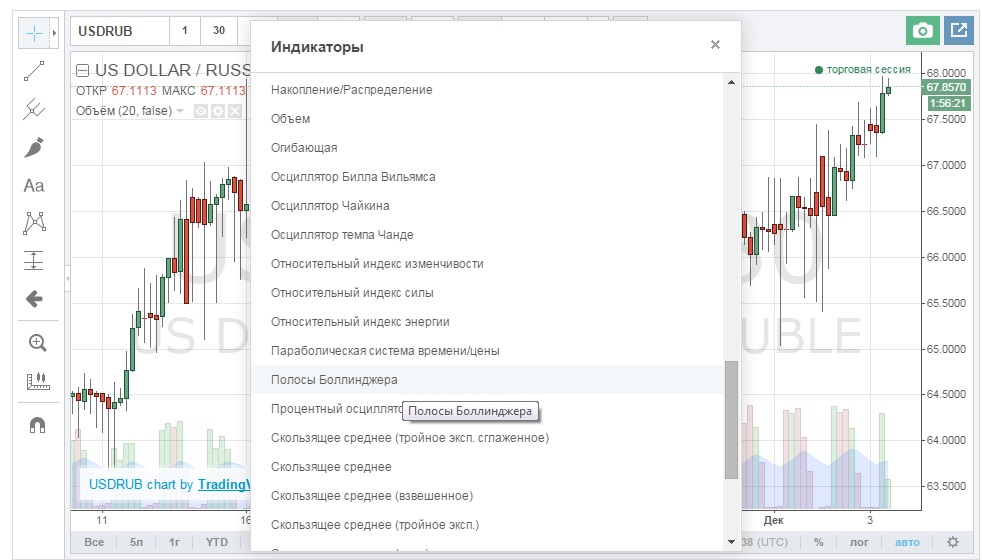
Most often, the Bolinger waves (or lines, or bands) are tested by absolutely every beginner who dreams of calling himself a binary “bison” in the future. And the established “bison” themselves often use waves. Their popularity is “fuelled” by simplicity and clarity. The main thing is effectiveness. It is important to grasp the mechanism, and then they will begin to work. Actually, waves are a ready strategy based on technical indicators. They are the ones that enjoy the status of a win-win in the world of binary options. Hence the success of the waves themselves. To start understanding the Bollinger Bands, let’s take a look at the picture, you can do the same on our Live Chart, on it this indicator is called “Bollinger Bands“:
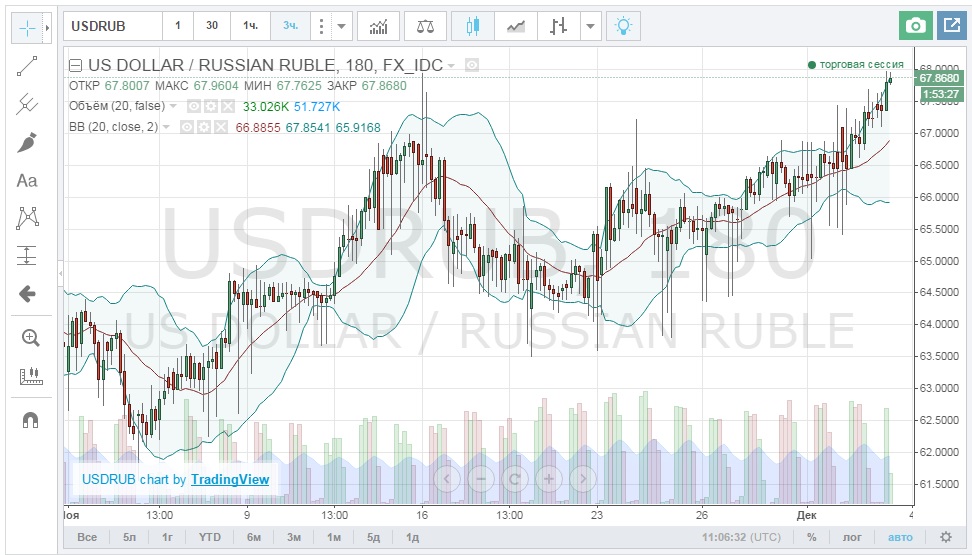
Waves are lines of three colors: purple, green, yellow. The highest price readings for a selected, specific period are “resting” on the upper bar, which connects them. This line is called the resistance line. The lower line is called the support line. And in between “passes” the channel of trend movement – the space where all of the chart indicators exist. What is actually the working mechanism of the tool? The lines show the best (ideal) moment to enter the market. When the upper line is crossed, the asset should be bought on a price fall. If the chart line falls below the support line, you should sell the asset on the price rise. But it is possible to “make” the most successful transaction when the chart is strongly deflected. That is, it not only touches the lines, not only crosses them, but also makes a sharp fall/sharp rise. But there is a downside to this success, because it is these sudden, critical movements that you have to wait for. Because binary options trades are extremely short-term, even these critical fluctuations should be taken as tentative.
To install the indicator, you just need to click on the mouse. We even choose the color of the bars, which will appear, in fact, on the chart. The point of the strategy is the statistical numbers, their provision. The average values between the lower and the upper limit are given. These values are given after analyzing ninety-five percent of the trades. A period of twenty days is usually scanned (the base value). But, as seen in the picture, you can also specify a maximum of fifty-four days in the settings. As soon as all values, including colors, are set, press the “Apply” button. Further work is shown in another picture:
What tools to choose for successful trading? The right set of tools is serious work, it is a conscious choice of robots, oscillators, strategiesthat will really help you in your work. Bollinger indicator for binary options – confidently note, an entire find for any speculator, an effective system that accurately shows signals new trends and overbought/oversold, which works perfectly in scalping, a prolonged bargaining process.
The tool is also called Bollinger Bands, and this is understandable, because on the chart, it takes the form of a channel, working with which you will decide for yourself what to bet.
The Bollinger Bands consist of:
- Central Line (it’s moving average with a specific type and period) and lines involved in the formation of the channel:
- top – 20 SMA (plus two standard offsets, this parameter is adjustable),
- lower – 20 SMA (minus two standard offs, this parameter is adjustable).
Trader can adjust line parameters (period, deviation type, etc.) at his own discretion, but it is worth remembering that when the period is reduced, the tool becomes more sensitive to false signals. Therefore, it is recommended to use the following Bollinger Bands period parameters: for short-term trading – 10 SMA, for medium-term – 20 SMA, for long-term – 50 SMA.
The indicator is suitable for the most precise tracking of current market trends, we can say, “shows the volume of the market” (i.e. what state the market is in at the moment: a flat or a trend), and is also indispensable in countertrend systemsThe tool is effective when it is used to determine if an asset is overbought or oversold. As the experience of foreign and Russian traders shows, the tool is more effective when used for trending.
How to trade on Bollinger Bands:
1.It is worthwhile to enter a trade after the price has broken through the center line in a particular direction, and to exit – at the moments when the price has reached the opposite line.
2.It is worthwhile to enter the trade against the current trend only after the price line has reached the instrument band.
3.It is also worth using the Stripes as a way of determining support and resistance levels, that’s enough strong signalIt’s worth taking a closer look at.
4.It can be combined with other means of market analysis, for example, MACD.
This legendary Wall Street tool in the arsenal of a professional is a source of constant income, a way to make trading accessible. Using it instead of other oscillators, you increase trading results in your account. More and more often speculators choose the Bollinger indicator for binary options (reviews below), which is no coincidence: it’s a truly authoritative tool that makes your bidding process a fascinating process.
Next, let’s move on to practice and to a specific trading tactic “Bollinger Waves in Binary Options” We’ll show you how to trade profitably using this indicator.
Reviews
Such simple and easy writing can be done by a person who is well versed in technical analysis. But it is a dark forest for an ordinary beginner. Even if one understands the meaning of these waves, there is still no 100% guarantee of successful trading. There is stock market news, political events, and much more that can drastically change exchange rates.
Nah, you still have to start somewhere. The news is news, but nobody cancelled the technical analysis. And you have to know and learn its principles if you’re new to it. You will never learn how to trade without it.
Technical analysis is the basis of all trading. And almost everyone should know about waves, too, if you want to trade seriously. Not everything is really as complicated as it seems at first glance.