VSA-Analysis – a Powerful Tool for Forex Market Analysis
VSA analysis (volume spread analysis) is a patented technique of market volume analysis with a range of candles (their size and shape). The technique was developed by the legend stock market by Richard Wyckoff in the late 1980s. The method received its modern interpretation thanks to Tom Williams, who tested FSA analysis for 15 years.
Contents
Beginner traders underestimate the importance and significance of market volume, but it is a very important factor if you want to make successful transactions in the Forex market (Forex Trading). Volume is the primary variable in any market, not just the currency market. It is the ratio of demand (buyers) and supply (sellers) that determines the fluctuation of prices and their growth. The biggest influence on the difference between supply and demand is exerted by the major market players, such as: large financial institutions, national banks, professional traders – they are also called market makers. To understand the importance of knowledge of market volumes, here is an example.
Imagine that there are only a dozen traders trading in the market (Forex Trading Training). Each of them applies their own proven trading strategy and strives to maximize profits (forex strategies). Let’s assume that nine traders have 100 euros on deposit. And one trader of the ten has exactly enough dollars to buy 900 euros from nine traders. And so this one trader redeems 900 euros through a broker NPBFX (go online). As a result, it turns out that 9 traders opened a sell deal, and 1 trader opened a buy deal. The volume window will display the value of the transaction in dollars at the current exchange rate, which will correspond to the value of the purchased 900 euros.
And as a result it turns out that all the money which was on the market turned out to be at the disposal of one trader, and now he can manage their market value as he wants – sell to whomever he wants and at whatever price he wants. So one big deal has more influence on the currency market and can manipulate it in one direction or another than nine small deals. That’s why it’s the market volume, not the number of trades made, which is important. That’s what VSA analysis is all about.
VSA analysis basics and trading method
The purpose of VSA-analysis – to determine the cause of price fluctuations, to understand the behavior of market makers and open a trading position in the same direction as they do, without giving the opportunity to “squeeze” themselves out of the market on a false correction or pullback prices.
Indicators for vsa analysis
- Spread (the distance between the high and low levels of the candle);
- In which area the candle closes (at the top/bottom, in the middle, or on the maximum/minimum);
- The volume that corresponds to this candle.
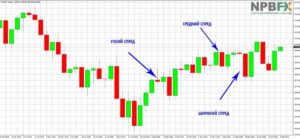
It is important to understand that the technique of vsa-analysis should not be taken as a ready-made trading strategy for making deals. VSA analysis basics and method gives an understanding of the causes of price chart fluctuations. As for the first indicator, there are no clear criteria by which to determine whether the spread is wide or narrow. The spread sizes of the neighboring candlesticks must always be taken into consideration. And depending on this, you should determine whether the spread is narrow, medium or wide in this case. Below is an illustrative example which shows where the spread is narrow, medium and wide:
Example of spread sizes
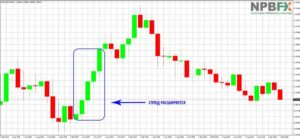
Keep in mind, the spread usually widens in the direction that the market makers we mentioned earlier would like the market to go. And, conversely, it narrows when the price goes in the opposite direction:
Spread widening
As a rule, at the beginning of each trend movement you can notice the presence of a phase in which the spread starts to gradually widen in the direction of the trend. It can be regarded as an additional proof that the trend is true and it is worth waiting for the growth of volumes. The second aspect – in what area the closing of the candle will happen, you can determine by eye, additional constructions are not necessary. If the price is located in the upper third on several up-calls, it is very likely that there will be a further growth in volume.
Note:
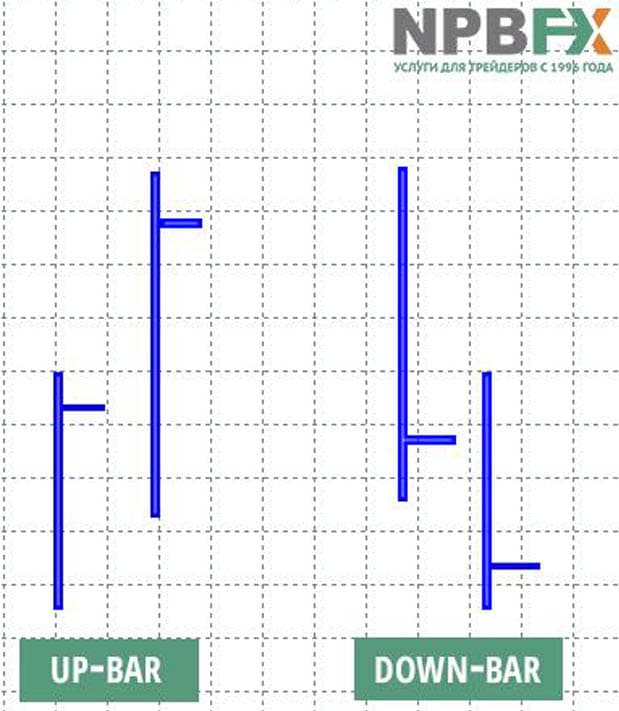
- Up-bar – when the closing price of the bar is higher than the previous bar;
- Down-bar – when the closing price of the bar is lower than the previous bar.
- Bullish volume increases on up-calls and bearish volume increases on down-calls.
What up/down candles look like
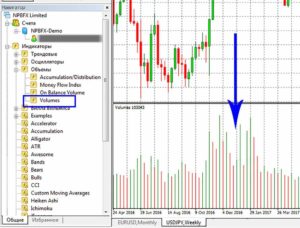
As for the third indicator – volume, in the vsa-analysis pay special attention to the values that stand out from the rest – the extreme volumes. They indicate that “smart money” (market makers) have entered the market. And to make it easier, we advise you to install the indicator “Volumes” in the trading terminal of the MT4 platform:
Volumes indicator in Metatrader4
According to statistics, market makers make up a small percentage of the driving force of the market – about 5%. However, the remaining 95% is the percentage of the crowd, which is the main driving force and gives money to the “sharks” of forex – market makers. The methodology of using vsa-analysis involves the use of all three of these indicators in combination.
Signals vsa pobar analysis
The number of bar analysis signals is enormous. Williams alone, in his writings, identified about 200 indicators for forex. In modern practice, there are about 400 signals, but there is no need to study such a huge number and memorize them, especially for a beginner trader. The main task of any signal is to give trader an idea about the situation on the market, its weakness and strength. Therefore, in practice it will be enough to get acquainted with 8-10 of the most important and popular indicators:
| Signal name | Interpretation in Russian | Description | Features |
| Stopping Action | stopping effect | Indicates the moment when the price stops its movement. It can serve as a signal to buy if the buyer is strong enough. And if the market is weak, it will indicate at what moment the uptrend can reverse in the nearest future. | Great for even beginner traders, because it is very well visible on the chart.
It is necessary to take into account the index of the spread volume and clearly fix the closing bar on the level. |
| Shorting of Thrust | Attempted sale | It signals an attempt by market makers to unobtrusively sell the asset so as not to scare away most of the smaller investors. | It’s easy to use.
Well recognizable on the chart, including small timeframes. Opposite to the Stopping Action signal. |
| Spring | Springing | Indicates that the price low of the asset has updated and will be followed by a sharp price reversal. | Does not work on a downtrend.
It refers to the signals of manipulation, its main purpose – to lure the late sellers into a “bear trap. |
| Up-Thrust | Trying up | Can serve as a signal to enter the market and displays when the price of an asset on the chart will try to go up, overcoming a certain resistance. | In the same way that Spring refers to manipulation signals.
Not good for an uptrend. |
| Jump over Creek | Jumping over the creek | Indicates when the price rises sharply and it is necessary to exit the trading range. | One of the most popular signals in vsa-analysis.
Doesn’t work for the resale strategy. |
| Back to Creek | Back to the creek | Displays the moment when the price returns to the previous resistance level, which has become support. | It is most suitable for opening a position upwards and indicates a good time to buy.
We advise you to study it on several timeframes at once, so as not to make hasty conclusions based only on the current moment. |
| Break under Ice | Falling through the ice | It helps to predict how the price will behave in the future: whether it will go up after the collapse or continue to fall down. | Its appearance indicates that the actions of “market makers” are behind the price movement.
It is considered an inverse and forms a downtrend. Accompanied by increased volume on the breakout bar. |
| Back to Ice | Return to the Ice level | It occurs at the moment when the direction of the price movement goes up and down to the Ice level. | Also, like the Break under Ice signal indicates that the price movement is caused by professionals. |
When using the signals described above, it is very important to interpret them correctly, taking into account the current market situation. You should not take the signals as ready-made patterns, always consider the market volumes and the left side of the chart, as well as pay attention to the strength and direction of the price movement. Only in this case, the vsa bar analysis will serve as an effective and useful tool for trading on the Forex market. In order to trade even more effectively, we advise to register on the Analytic portal of the reliable broker NPBFX, there you will find all the latest trading signals that will help to make the right decision and promptly orientate in the market situation:
Advantages and disadvantages of vsa analysis
Benefits:
- The vsa volume analysis is versatile enough, it does not need to be optimized for specific trading instruments, it is suitable not only for the Forex market. It is used in the stock market, commodity market, etc;
- The methodology of vsa analysis is really unique in the study of seller and buyer behavior patterns and allows you to bypass the limitations of technical analysis and the classic fundamental;
- In the analysis of market volumes vsa-analysis will help to understand not only their direction, but also the strength of the future trend, which is even more accurate will help you decide on the choice of trading strategy.
Disadvantages:
- Not quite suitable for beginners: to master vsa market analysis, basic knowledge of the principles of making deals in forex is not enough. To learn how to successfully apply this type of analysis in real trading, you need to test it for a sufficient amount of time on a demo account (Forex Trading Training);
- Not suitable for traders who use high-frequency trading on short timeframes. Here, it is better to apply classical tehanalysis.
Tips for using vsa analysis
When working with tick volumes we recommend to compare quotes in several Forex brokers. They should not differ too much from the market average. For example, NPBFX – a broker that does not “render” quotes, but only acts as an intermediary between the trader and liquidity providers. And this is an ideal case where the trader can safely use vsa volume and spread analysis.
Use vsa forex analysis with caution during average volumes. During periods of consolidation, accuracy may be less than during peaks and market-oriented methods may fail. Do not focus solely on the signals of the patterns “Lack of Supply/Demand”, “Surrender of a Seller/Buyer”, etc., always complement them with graphical and technical analysis. Be sure to wait for a clear set-up and make sure that the market volume method is applicable in this case. Analyze the volumes on the market separately from the price and use a chart of market volume indicators with the development of trend channels, key levels, divergences, standard figures such as: “Flag”, “Triangle”, “Head-Shoulder”.
To summarize, I would like to note that the bar analysis vsa is a fairly accurate method of assessing the market situation, proven over the years. It will be useful for every trader and will help to become a professional in trading. On NPBFX analytics portal you can find a lot of useful information not only in the context of this article – basics of bar analysis and vsa signals, but also on forex trading in general. Vast experience and reliability of this broker (it has been on the market since 1996) will let you reach a whole new level of trading. Register on the broker’s website and be successful together with NPBFX!

Reviews
VSA cannot be considered a trading strategy in the sense that it does not provide clear rules for opening/closing a position as it is accepted in technical analysis. In this case, a trader gets a general technique of “reading the market” by market volumes, which allows, firstly, to see the moment when big players (smart money) appear on the market. Secondly, to follow them and not to give an opportunity to squeeze himself out of the market on a false pullback or correction.