RSI (Relative Strength Index) Oscillator
Contents
- 1 Description of the RSI oscillator
- 2 Calculation formula
- 3 Advantages of the oscillator
- 4 How to add RSI to MetaTrader 4?
- 5 How to add RSI in MetaTrader 5?
- 6 How to add RSI to the broker’s terminal?
- 7 How to install the oscillator in the terminal?
- 8 RSI Trading Signals
- 9 RSI signals in MetaTrader 4
- 10 RSI signals in Binomo
- 11 RSI Signals at ExpertOption
- 12 Strategies with RSI
Description of the RSI oscillator
In order to succeed in the marketplace binary options tradingThe trader will need “assistants” who can perform a number of roles and thereby help the player to determine the current market sentiment, to enter positions in time, to track reversals, etc. In trading, the toolkit with which the players work is of great importance, this directly affects their performance. Both standard and proprietary, complex and rare tools are used here.
RSI (relative strength index), which we will talk about today, is usually part of the standard set of Binary options oscillators variously platforms. It is one of those instruments that players get acquainted with first of all and, of course, it is safe to conclude that there is no player in the market who has never heard of it or used it. Its author is Wells Wider. He mentioned his instrument for the first time in 1978, and since then it is one of the oldest and favorite oscillators of many market players. Thanks to the recommendations of the author of the tool, it is customary to set the period of RSI equal to 14. As for its full name, it does not exactly define the tool: it determines not the relative forces of assets, but rather their internal forces. However, this does not prevent it from being a popular and reliable instrument, just as it was decades ago.
A number of trading systems, both simple and complex, are based on its readings, it enjoys great trust from traders and this is justified – being an oscillating instrument, it is able to determine valuable information about the dynamics of assets: current moods, moments of extremes, possible reversals, data on the change of mood and the arrival of new forces in the market. In addition, the data it generates is simple, definite, and accurate – all this, of course, could not fail to be noticed by traders.
It is also preferred because it generates its data ahead of time, which is very valuable in options trading. Considering all this, we can conclude that this is one of the main tools encountered by market players. As the standard oscillator, the RSI does not take into account the averaging information in its calculations, which allows it to be leading instead of lagging like many other instruments. Thus, by adding it to the chart you can get information about the market changes in advance. Like other sub-tools, it is shown in a separate window when attached to the chart as a line fluctuating from 0 to 100 and with 2 levels.
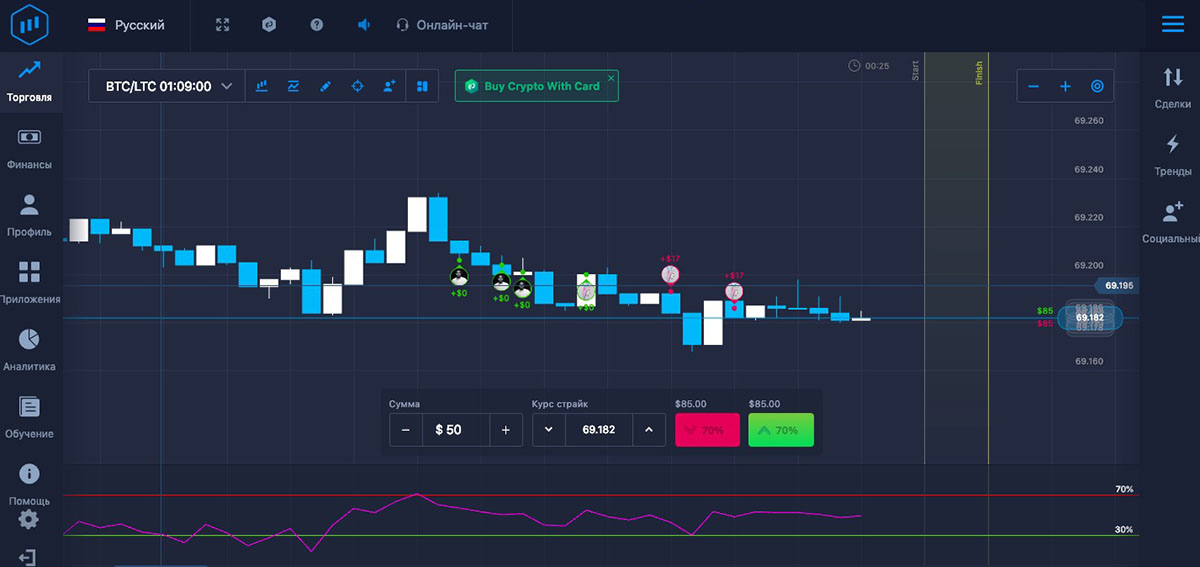
Log into your broker’s terminal, add the RSI oscillator to the chart and see what comes out
| Broker | Bonuses | Open an account |
|---|---|---|
|
1
|
50 %
Bonus on deposit from $100 USD – promo code WELCOME50
|
Start |
|
2
|
5 %
Bonus when depositing via USDT (TRC20)
|
Start |
|
3
|
Cashback
Refunds of commissions, spreads and other costs
|
Start |
|
4
|
15 %
Bonus 15% on deposit by promo code iCGSbEgiAR
|
Start |
|
5
|
100 %
First deposit bonus
|
Start |
Calculation formula
RSI = 100 – (100 / (1 + U/D), where:
U is the average value of positive price dynamics;
D – the average value of the negative value dynamics.
Advantages of the oscillator
If we talk about the advantages of this tool, of course, it has plenty of them, otherwise it would not be so popular. Existing on the market for about 40 years, it is more than relevant today and its potential is difficult to replace with other tools. It is simple and straightforward, when interpreting the data it generates signals It does not require sophisticated knowledge of the market, it will be indispensable for any length and complexity of trading methodology and strategies. Studying it, the trader does not have to go into the principles of its calculations, the rules of searching its data, it does not need complex training programs, video lessons (Binary options trading training). On the contrary, everything here is simple and clear, and after taking the time to study its possibilities, you can immediately start trading in order to consolidate the information.
Accurately working both in conditions of obvious trends and in their absence, it provides information in advance, which, if used correctly, can lead the trader to a positive outcome of trading. Today it can be found in the arsenal of both market professionals and beginners in options trading who are just beginning to explore their possibilities. Generating quality information about the market, it is of course incredibly popular and is among a large number of strategies, is able to inform players in advance about pullbacks, future reversals, extremum states (oversold and overbought data).
Its outpacing nature of information is what is actively used by traders, what makes it popular, even though new and new, seemingly more effective oscillating systems are constantly emerging. It is accepted to use it with other tools, which makes the work doubly effective, it is, for example, EMA, MACD etc.
How to add RSI to MetaTrader 4?
In popular trading software, this tool is offered as a standard oscillator, it is already installed in the program and is available after installing it on your computer. To start working with it, it is necessary to add it to the trading chart, to do this, you need to find it in the list of oscillators through the menu (“Insert” – “Indicators” – “Oscillators”) and click on its name. It is also offered to configure it:
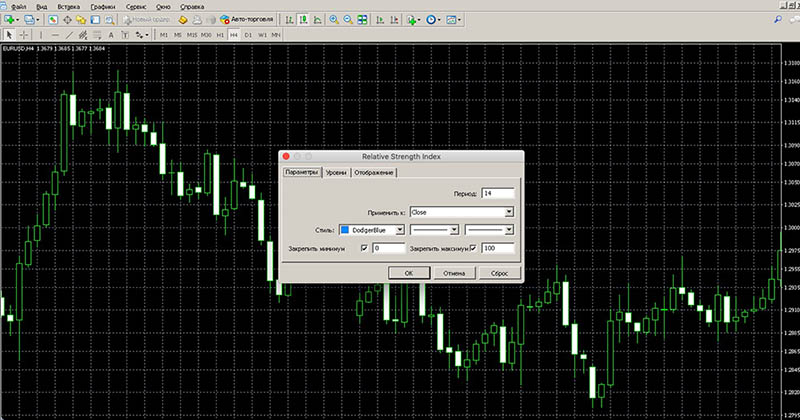
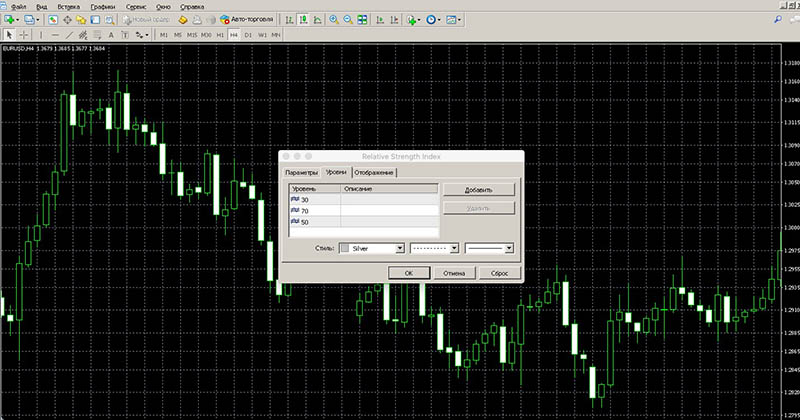
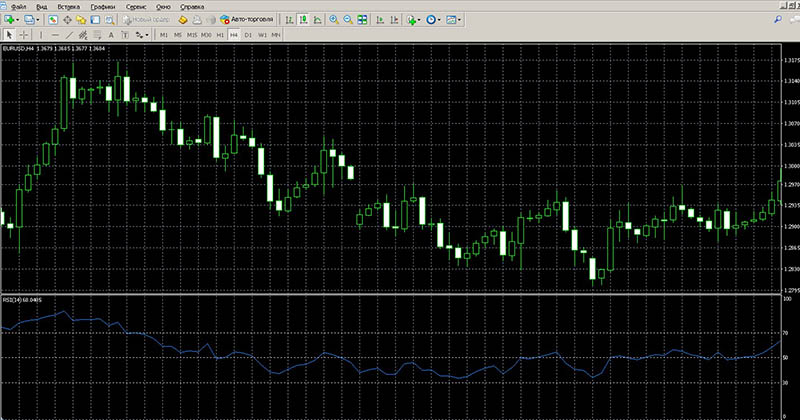
Then, when the tool is ready to work, you only need to use the “OK” button and you can work with its data:
How to add RSI in MetaTrader 5?
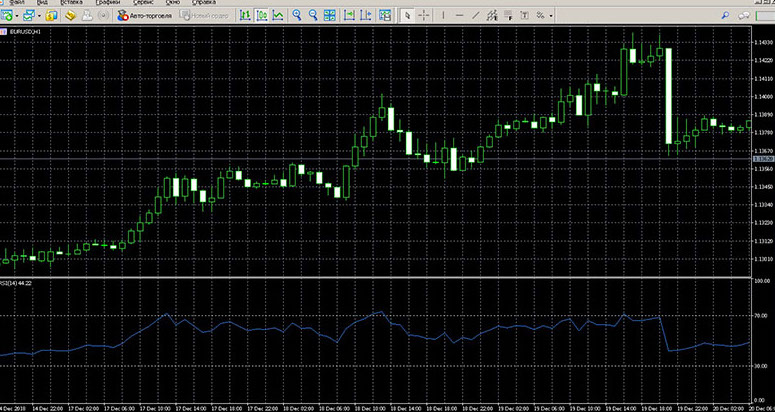
Exactly the same instructions for adding a tool can be used if you work in the program MT5, which is a more advanced platform updated version of the previous terminal. After making the settings, the tool is ready to work:
How to add RSI to the broker’s terminal?
- Finmax
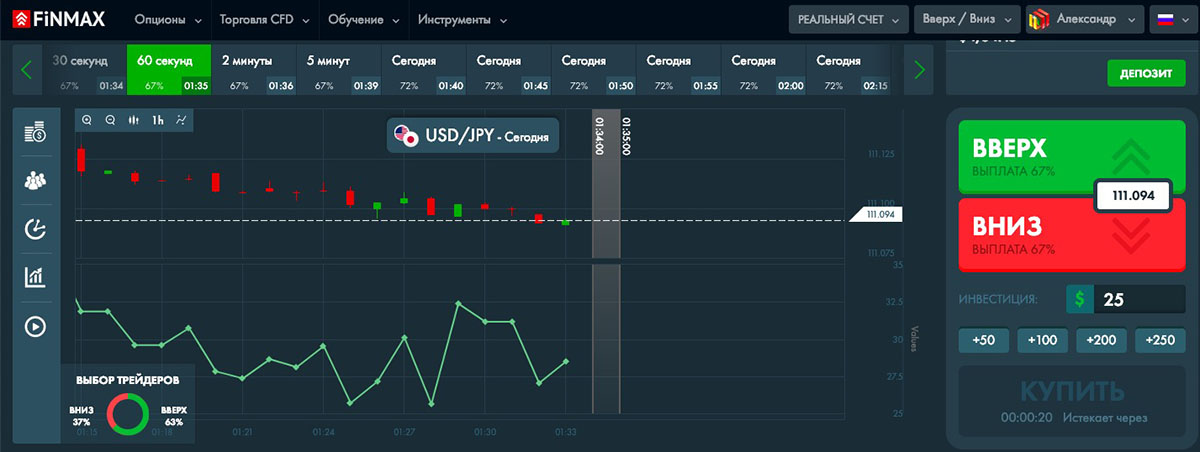
Justifiably considered one of the leading organizations in the options market, this company is interested in providing customers with a variety of options for analyzing asset dynamics. This includes oscillators and Indicators for Binary Options. And, although there are very few of them for an organization with such a strong reputation as Finmax, it gives the opportunity to carry out the simplest market analysis. Among the available tools is RSI. To work with this or other tools in the platform, just open the menu, located for convenience immediately in the working window:
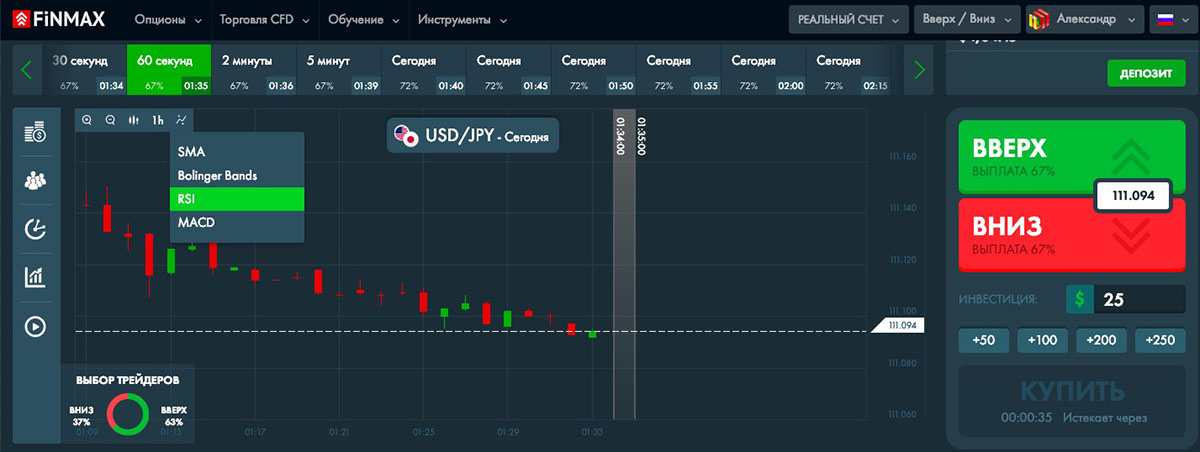
By clicking on the instrument name, it is easy to add it and start working with it. There is no possibility to customize oscillators here, so you will have to work with their standard settings:
It is also rightly considered as one of the leading brokerage platforms, where different possibilities for market analytics are available. Including here is available the tool we describe. To add it to the platform, just use the menu in the bottom toolbar:
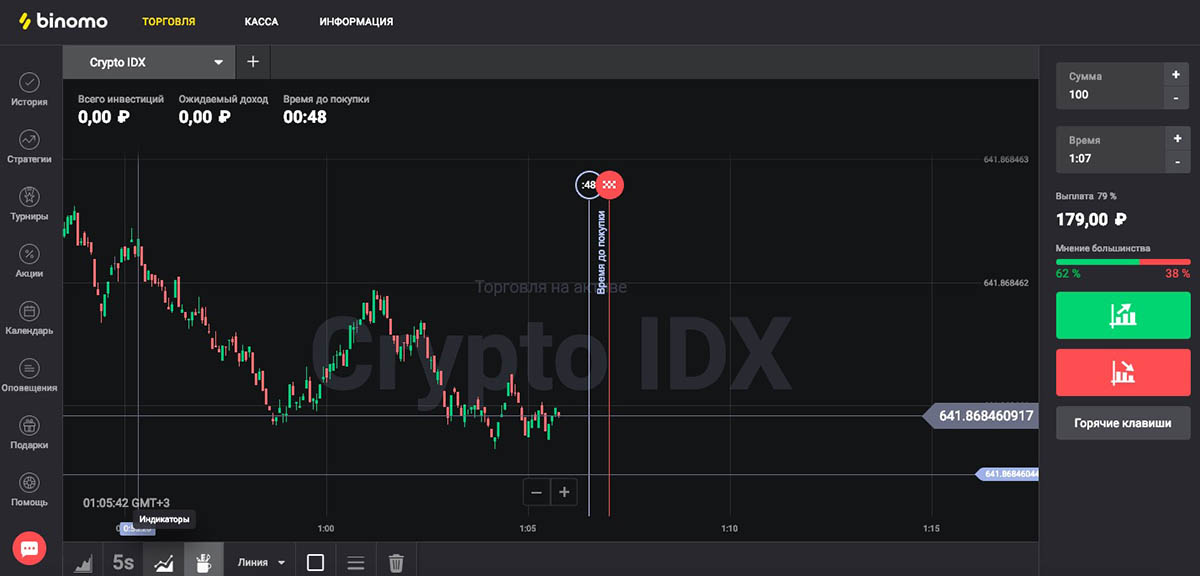
Unlike Finmax, there are more analytical tools available here, and you can customize them in any way you want. In order to choose from the list of instruments you need to work, you only need to click on it:
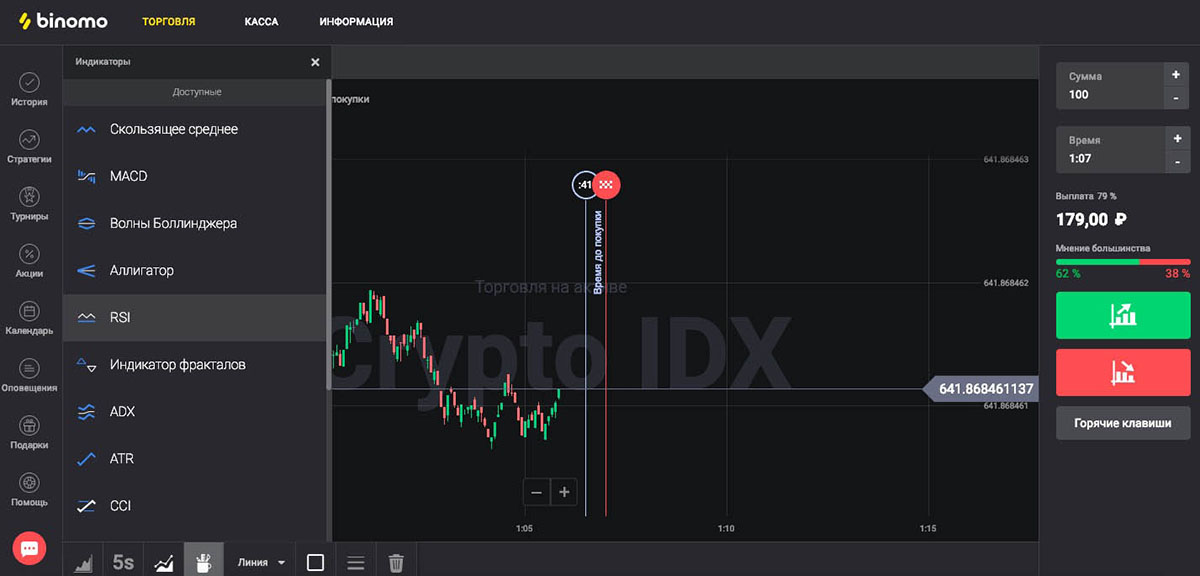
Now you can set it up:
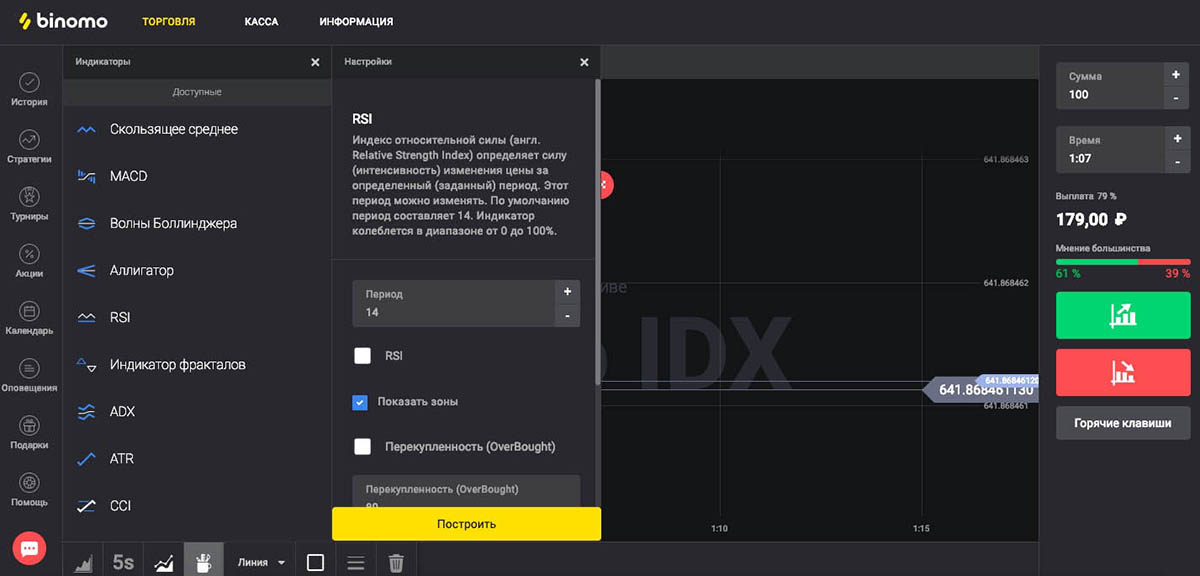
Then you can add it to the trading chart using the “Build” button:
In this one of the interesting and promising young brokerage organizations, many tools are also available for analyzing the dynamics of assets. There is RSI here as well. The list of available instruments can be explored in a separate list “Indicators”, available to the player here in the main work panel:
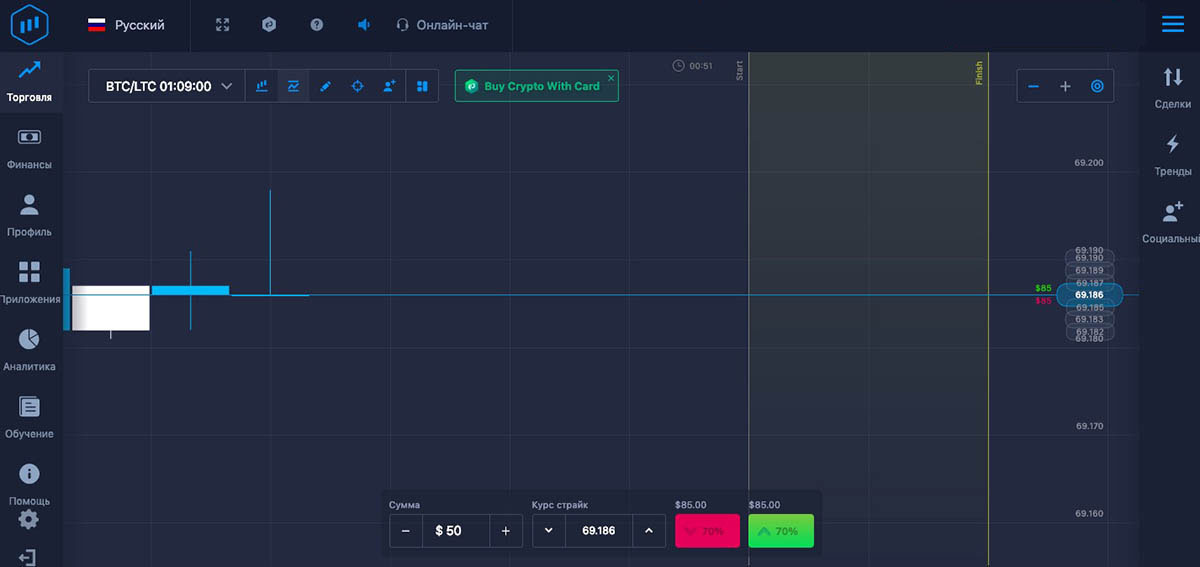
You only need to click on the name of the tool to select the necessary ones:
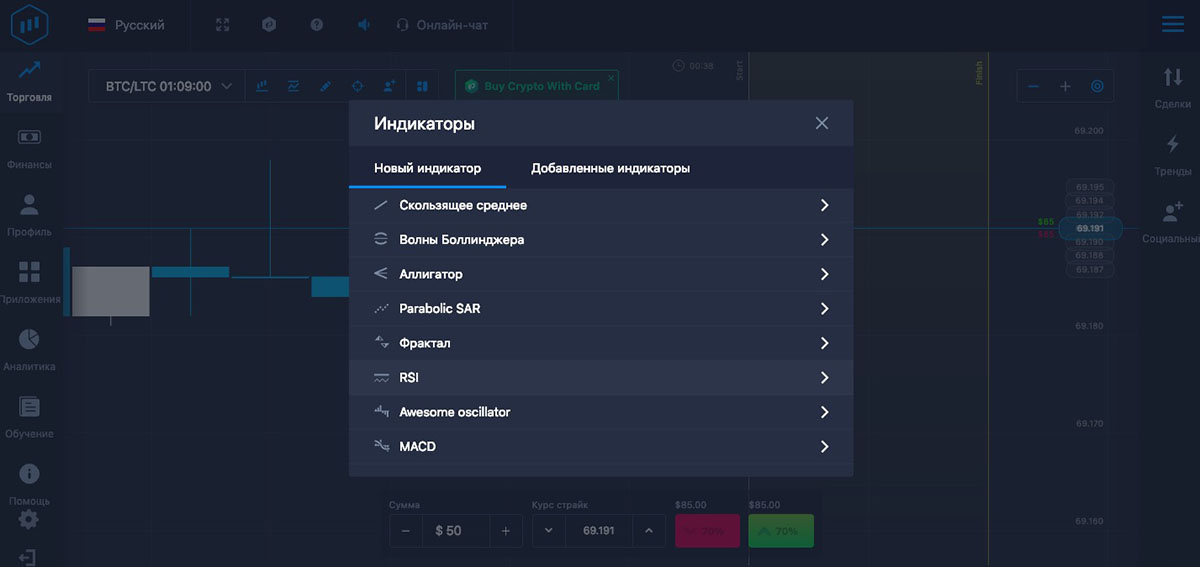
Now all that’s left is to set it up:
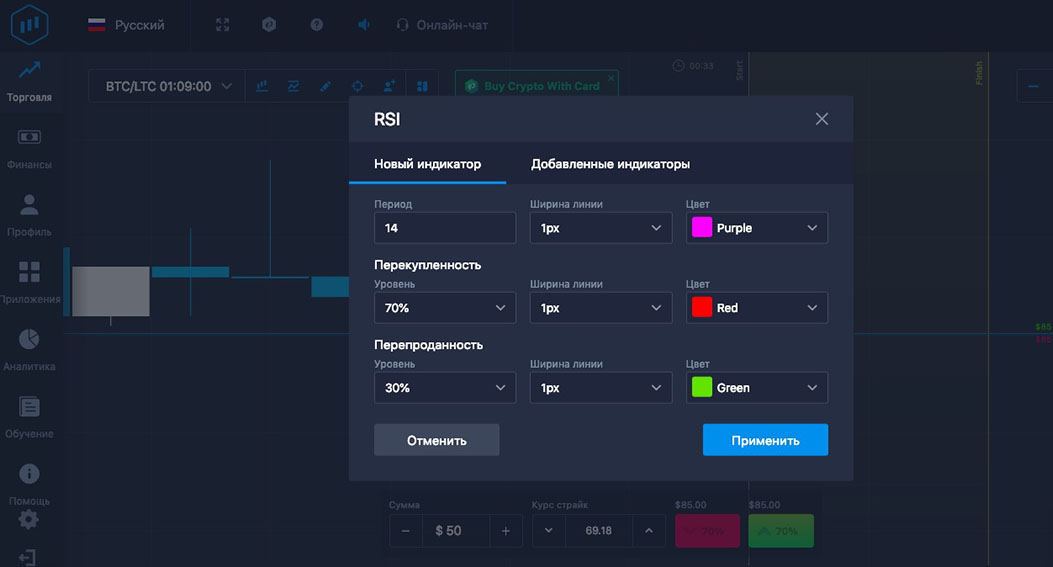
All you have to do is add it to the graphic using the “Apply” button:
How to install the oscillator in the terminal?
What should be a comfortable platform? This question is interesting both for the professional player and the beginner. Of course, the best such trading programs offer a maximum of useful options, we can even say that some of them have unlimited possibilities for work. These are analytics, work with different strategies, types of trading, types of assets, etc.
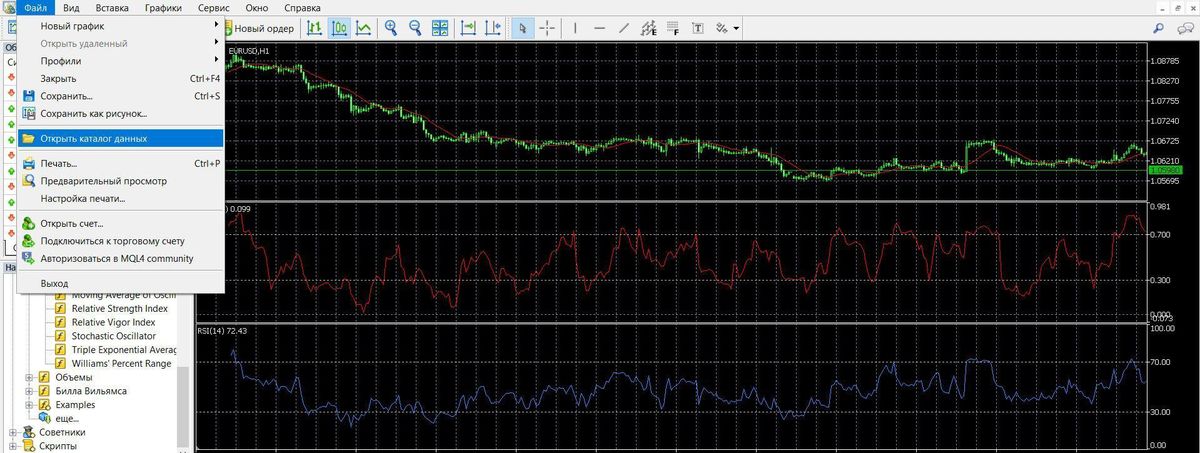
The Metatrader 4 (Metatrader 5) platform can undoubtedly be referred to such a program, offering, perhaps, the largest set of possibilities to the player in the market. The option of downloading new oscillators to the program, necessary to implement different strategies, is available here. It is very simple and even a beginner can cope with it. Having found a file of the desired oscillator on the Internet, it is necessary to open the data directory of the software:
Then go to the indicators folder (“MQL4” – “Indicators”):
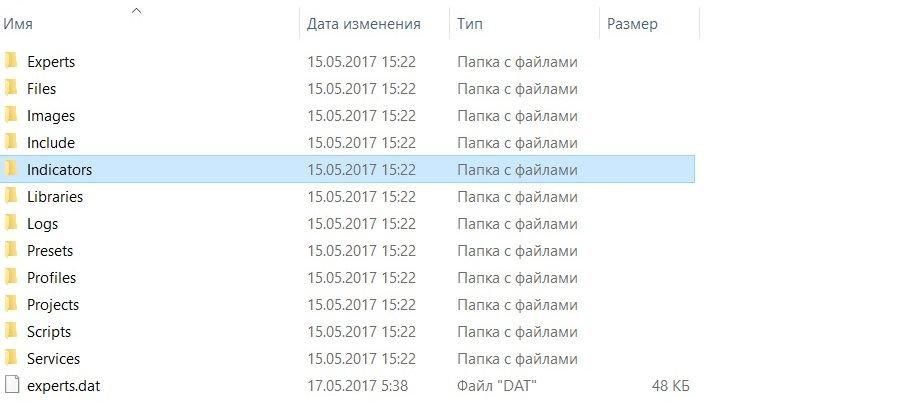
All the oscillators, scripts and trading systems uploaded by the player are located here:
After the file is simply copied here, the player just has to reload the program (close and open it), see if it is among the user oscillators and that’s it – you can work with it by attaching it to the chart and making the necessary adjustments:
RSI Trading Signals
Overbought/oversold:
- When the value of the instrument approached the mark 70, we should talk about overbought, it is customary to make bets with the value DOWN,
- If its line is close to 30, we should talk about oversold, it is customary to place bets with the value UP.
Crossing the center line:
- When the instrument crosses the 50 mark heading upward, it is advisable to place a Koll bet,
- When it crosses the same index, but heading downward, it is advisable to place PUT bets.
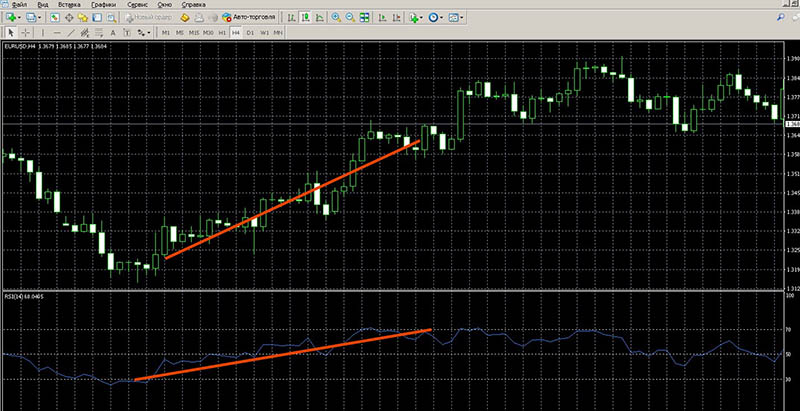
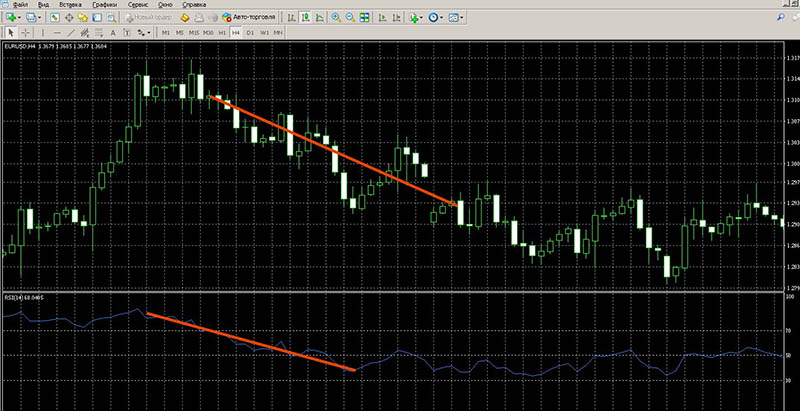
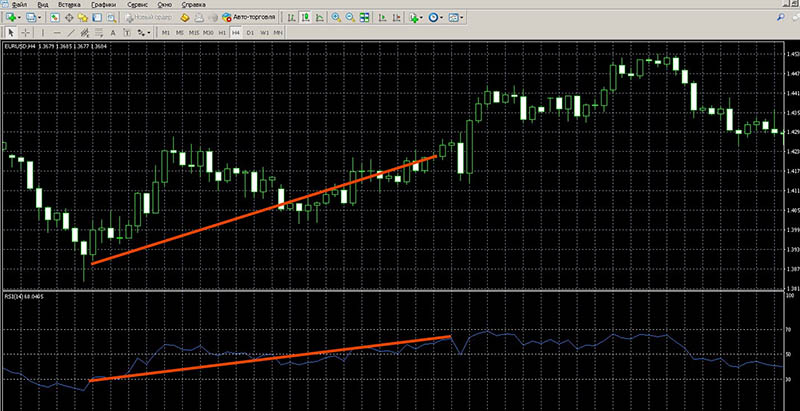
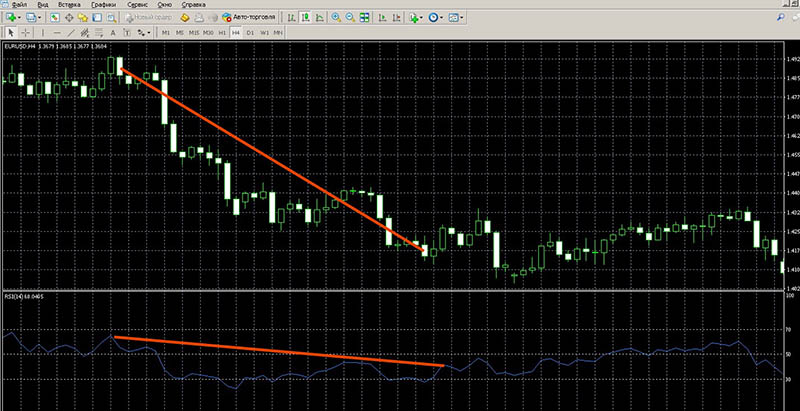
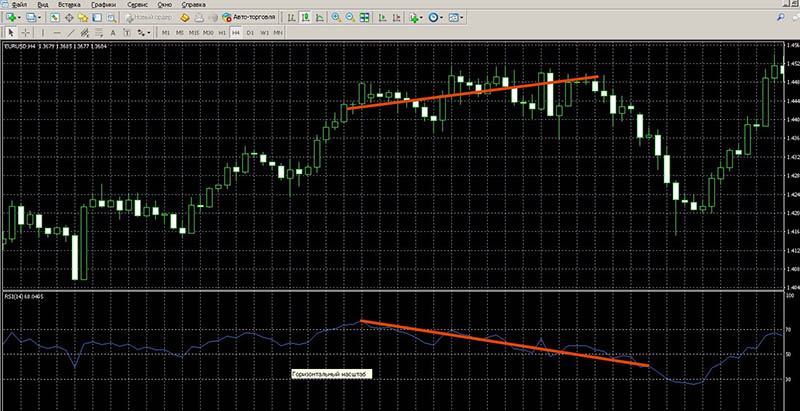
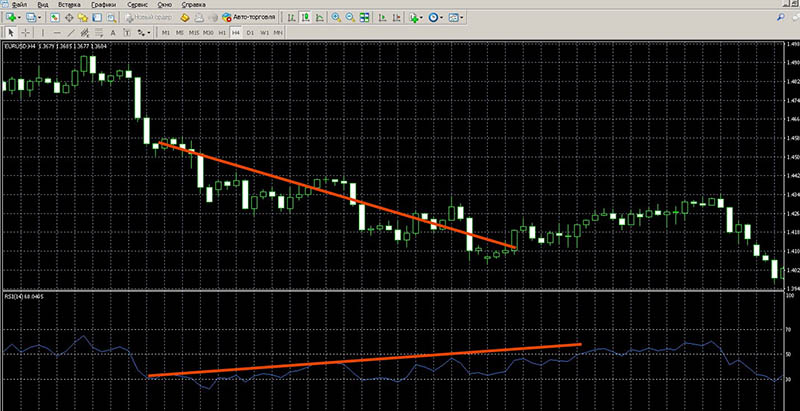
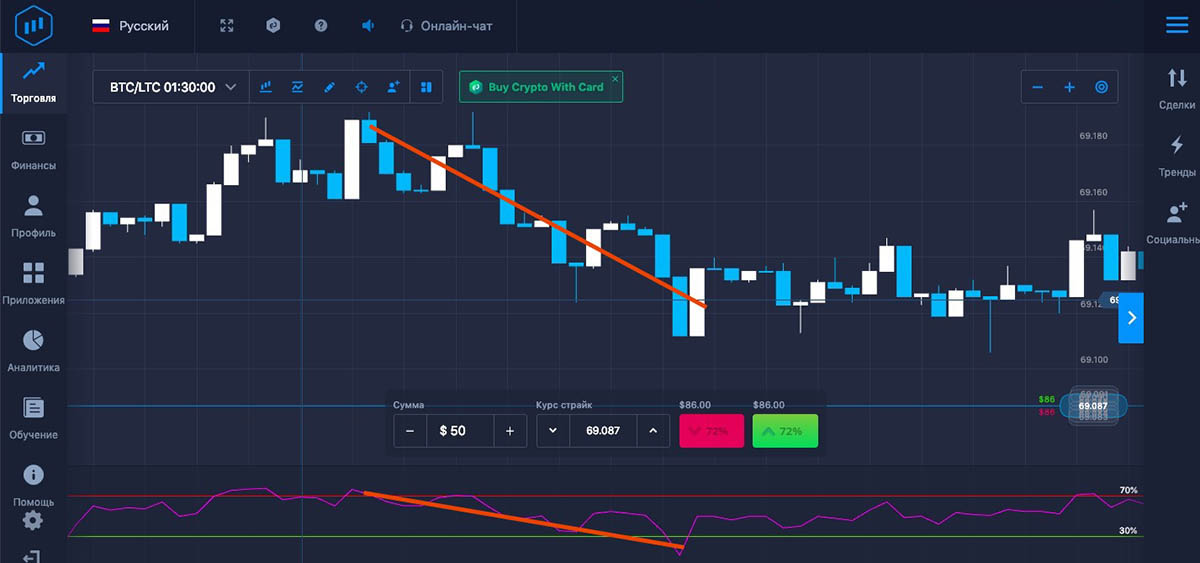
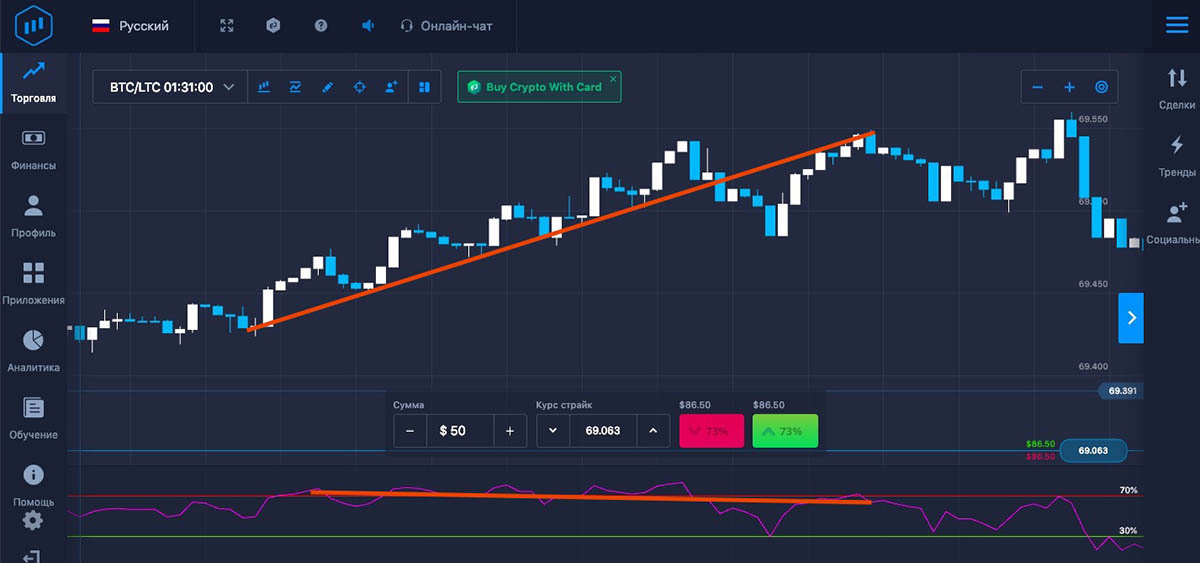
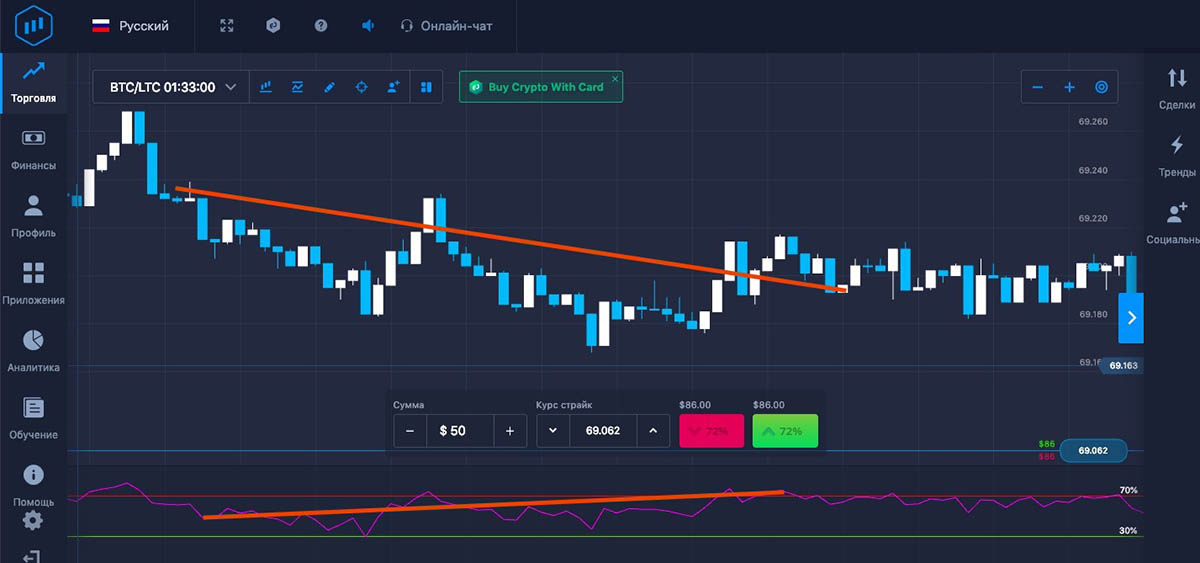
Discrepancies in the value and RSI data:
- When the highs of the value are not confirmed by the behavior of the RSI, we are facing a divergence, it is recommended to work with bets to the UP,
- When the value lows are not confirmed by the behavior of the RSI, we are facing a convergence, it is recommended to work with the rates DOWN.
RSI signals in MetaTrader 4
- Overbought/oversold
Registration of transactions KOLL:
The registration of PUT rates:
- Crossing the center line
Implementation of KOLL contracts:
Implementation of PUT contracts:
- Value and RSI discrepancies
Up Bets:
DOWN stakes:
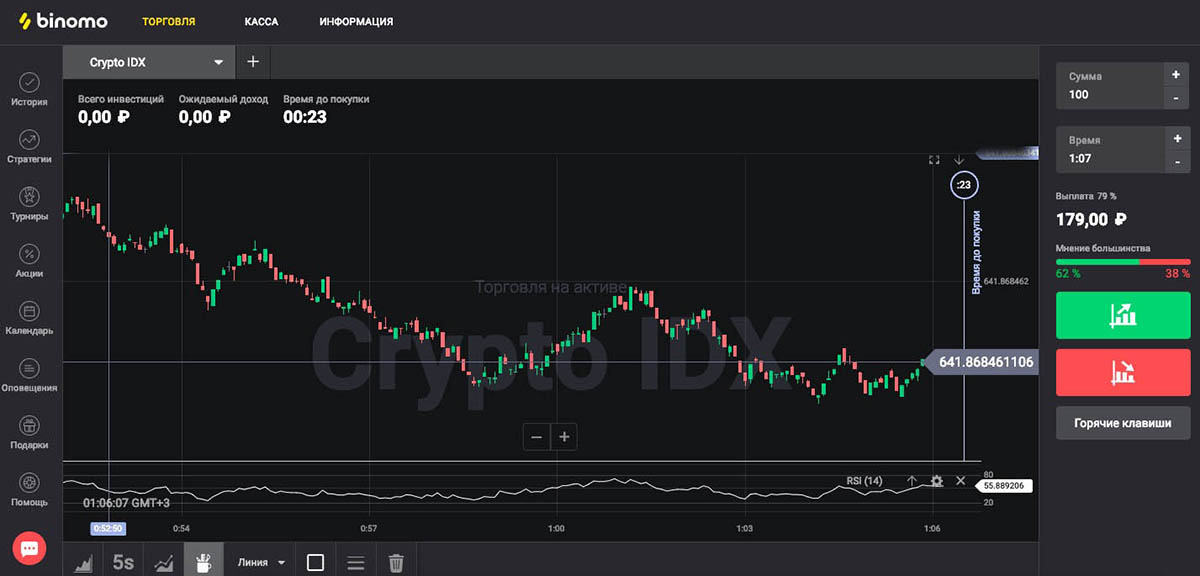
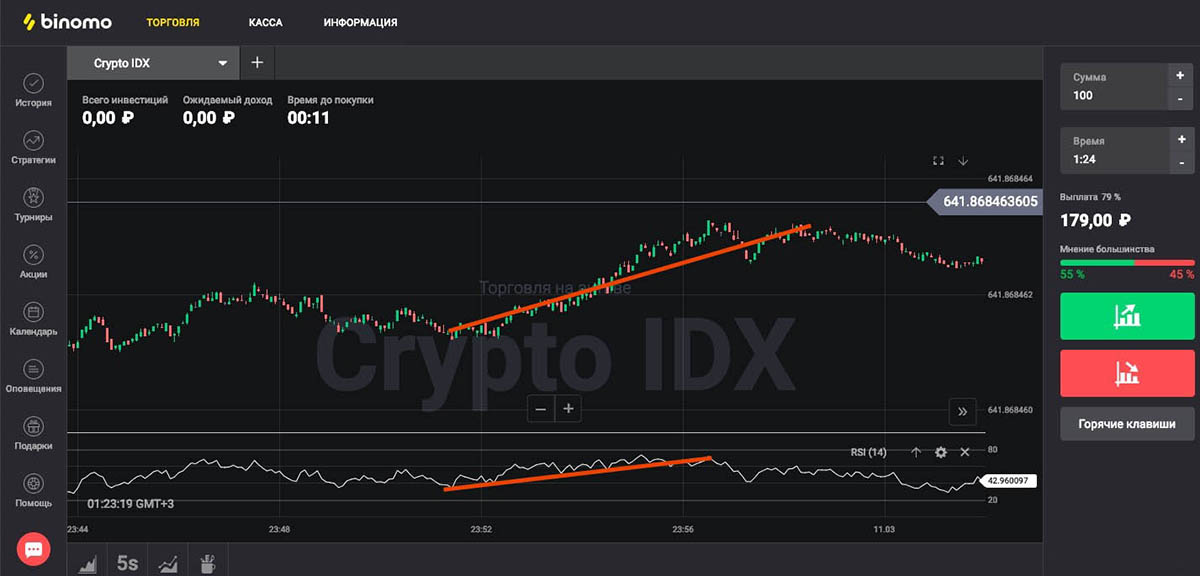
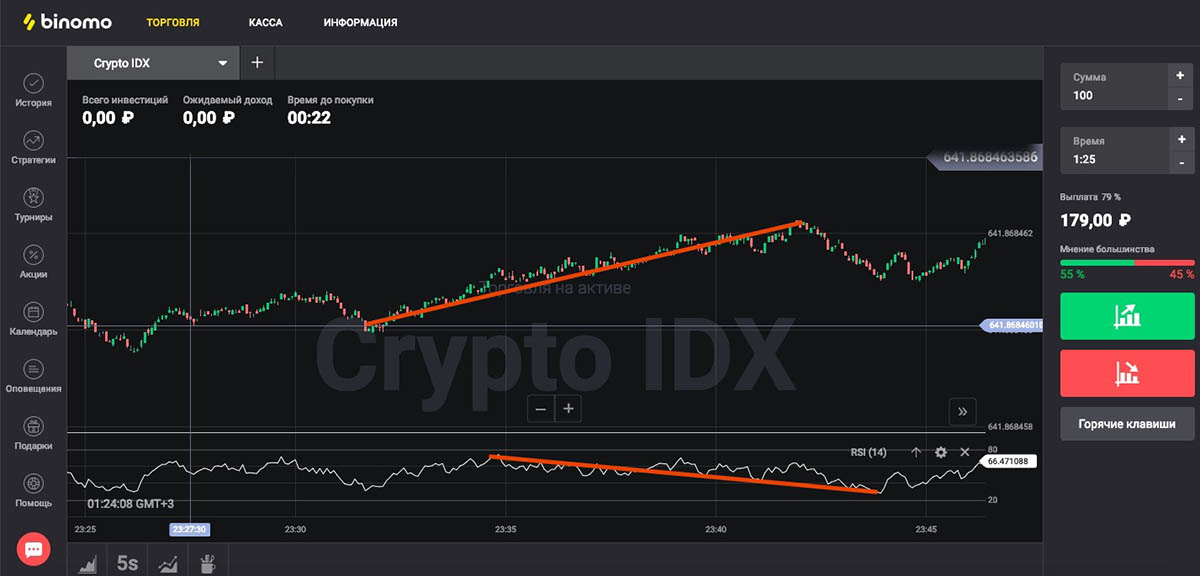
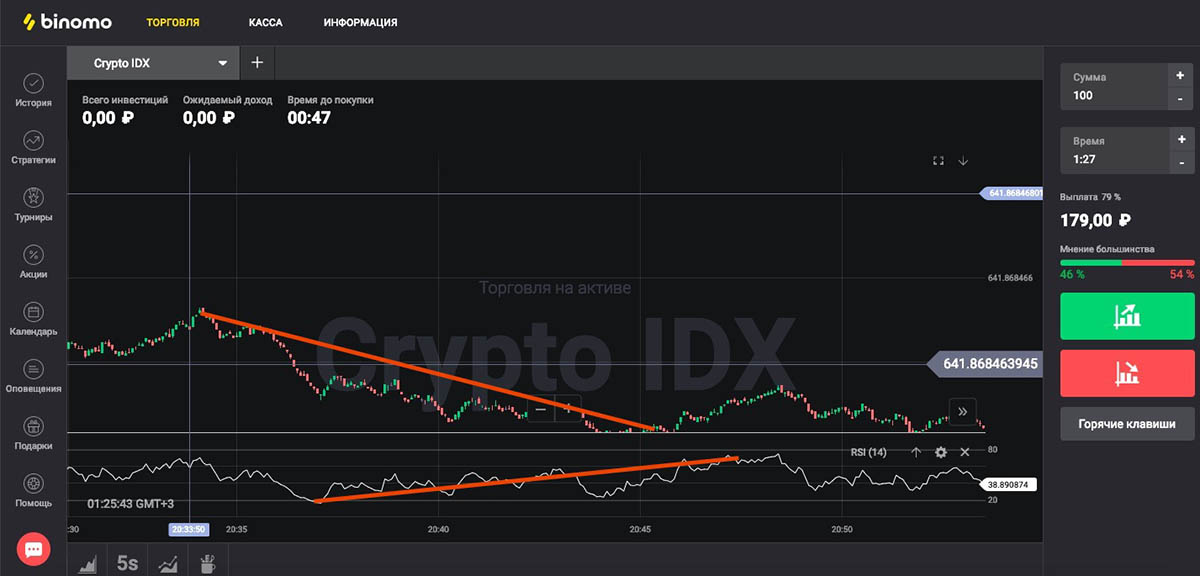
RSI signals in Binomo
- Overbought/oversold
Registration of transactions KOLL:
The registration of PUT rates:
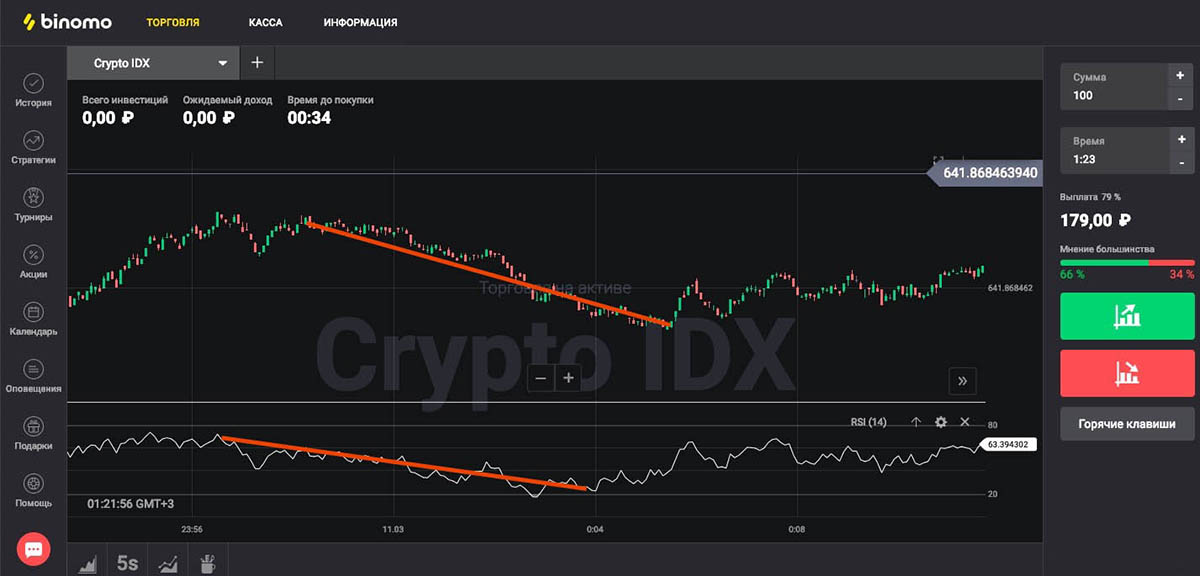
- Value and RSI discrepancies
Up Bets:
DOWN stakes:
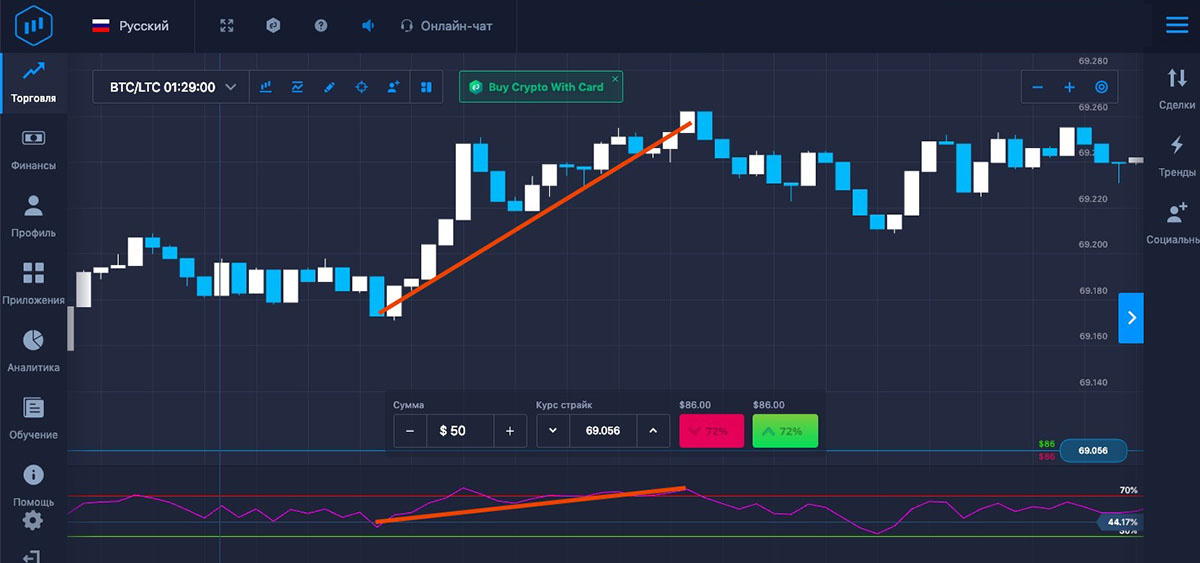
RSI Signals at ExpertOption
- Overbought/oversold
KOLL betting:
The registration of PUT rates:
- Value and RSI discrepancies
Up Bets:
DOWN stakes:
Strategies with RSI
This trading algorithm will be useful for market players, because it is simple and clear. In addition, thanks to the use of serious tools, the methodology is effective, offering accurate data on market sentiment. The role of the MACD here is to determine the divergence between sliding of different periods, in search of current sentiment. The RSI will allow you to identify the main trends in the dynamics of the asset, identifies unstable zones, which are replaced by a new sentiment of the bidders.
In order to place growth bets, the following instrument data must be identified: the RSI must cross below the 30 mark, indicating rising sentiment; the white moving MACD is preparing to reverse; a green candle closes in the market, indicating growth. In order to place downside bets, the following instrument data must be identified: the RSI must now cross above the 70 mark, indicating a falling mood; the white moving MACD is again preparing for a reversal; a red candle closes in the market, indicating a fall.
This is another simple but effective system that allows you to get decent results from the market. Its success is based on taking advantage of two powerful tools at once: Bollinger Bandswhich is basic in players, capable of accurately identifying data on divergences, mid-level crossings and breakdowns; RSI, which acts as a filter of false data, recognizing points of change in the mood of bidders. For the implementation of the Koll bets, the tools of the method should show the following indicators: there is a rising sentiment on the chart, the RSI enters the OverBought area. For realization of PUT bets the same tools should show other indicators: there is a downward mood on the chart, RSI enters the OverSold area.
Most options traders are well aware that Moving Average – is a powerful tool, which is not in vain so often found in different methodologies. Its advantage is that it allows to operate with the valuable data provided to the player from MA: it shows the “inertia” of the value, that is, where it should be located, if it were not influenced by different factors. Thanks to another powerful tool, RSI, the system is more efficient, because false readings are excluded. In addition, this equally popular tool determines the state of the market, divergence. This trading algorithm will be optimal for the professional as well as for the beginner, which, of course, is also its advantage. To create trades to buy, the instruments must generate the following data: RSI crosses the 50 mark and breaks it from below; a rising candle crosses the MA from below. To place sell bets, instruments must generate the following data: RSI, crossing the 50 mark, breaks it from above; a falling candle crosses the MA from above.
One powerful tool that players should definitely become familiar with is Parabolic SAR. It is simple, easy to work with, but it generates valuable information about reversals, changes in the market mood, and when it is better to close positions and win on it. By being ahead of the curve, it also solves the problem of delayed readings. Of course, this justifies its popularity and its “participation” in various methods. Another strong tool of this algorithm is RSI, also a reliable tool familiar to players. Its merit is that it allows you to accurately determine the strength of the mood of trading participants, their change, nature, reversals, phases of extrema. To implement the KOLL orders, the tools must demonstrate the following indicators: the RSI enters the bottom oversold zone, and the Parabolic is located just below the candlestick.