Bollinger Bands Indicator
Contents
- 1 Description of the Bollinger Bands indicator
- 2 Calculation formula
- 3 Advantages of the indicator
- 4 How to add Bollinger Bands to MetaTrader4?
- 5 How to add Bollinger Bands to MetaTrader5?
- 6 How to add Bollinger Bands to the broker’s terminal?
- 7 How to install the indicator in the terminal?
- 8 Bollinger Band Trading Signals
- 9 Bollinger Band Signals in MetaTrader 4
- 10 Bollinger Band Signals in MetaTrader 5
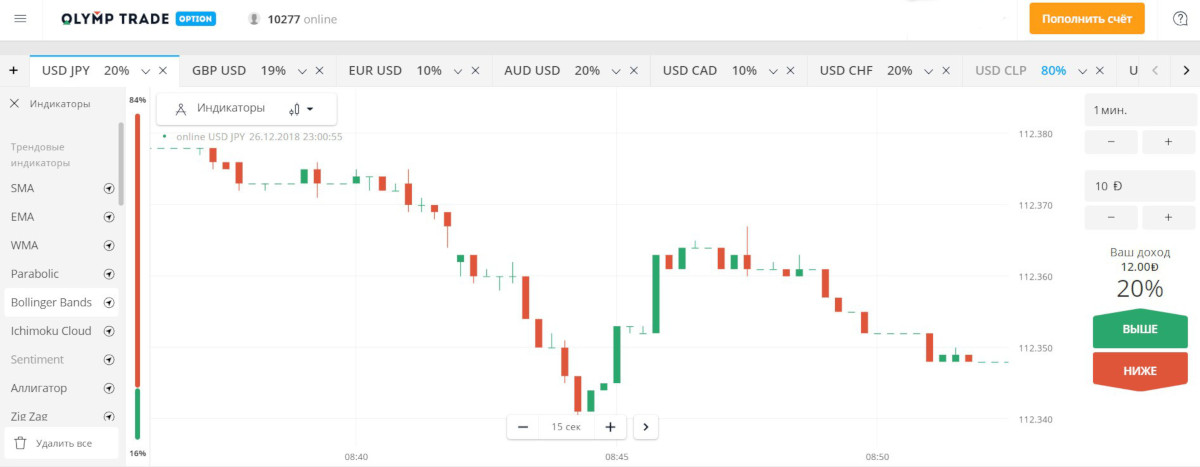
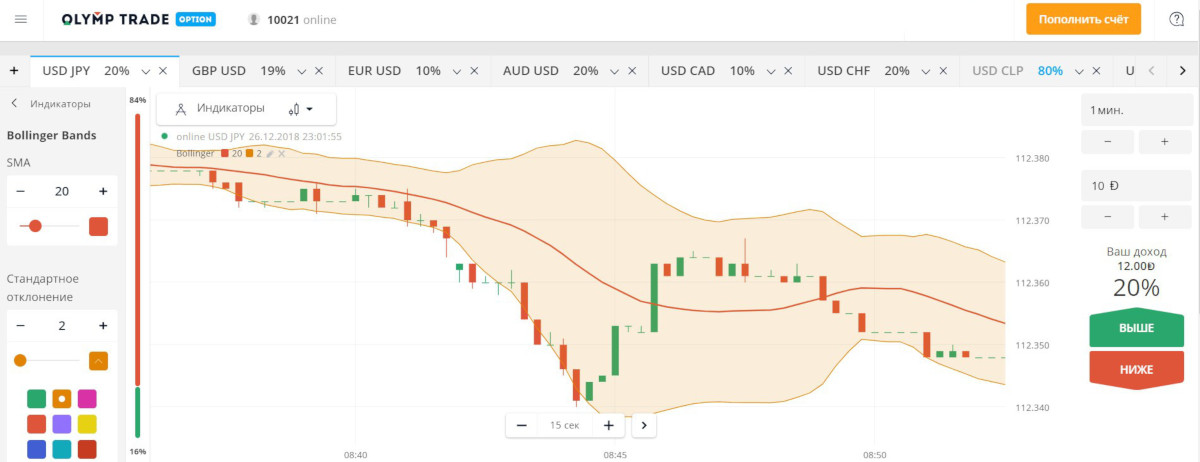
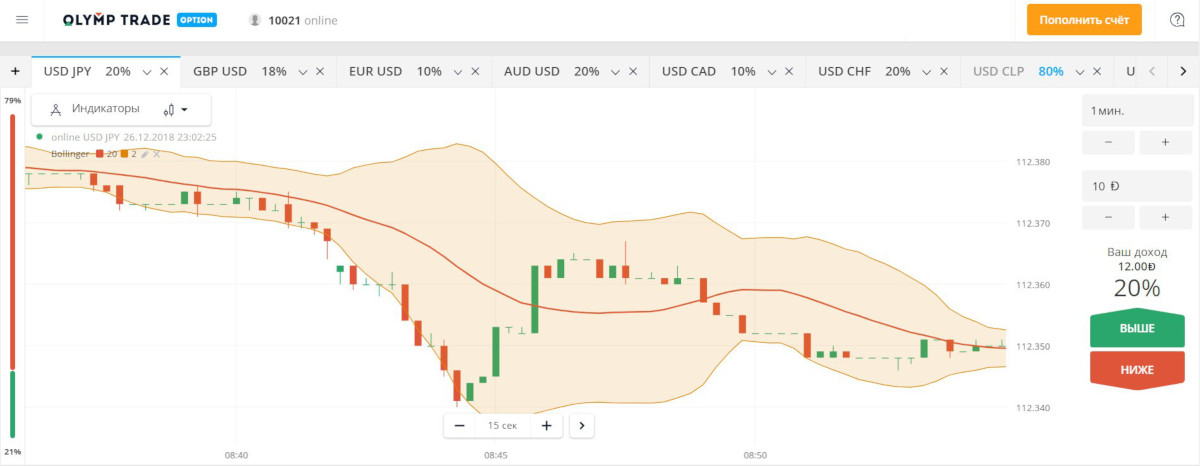
- 11 Bollinger Band Signals at Olimp Trade
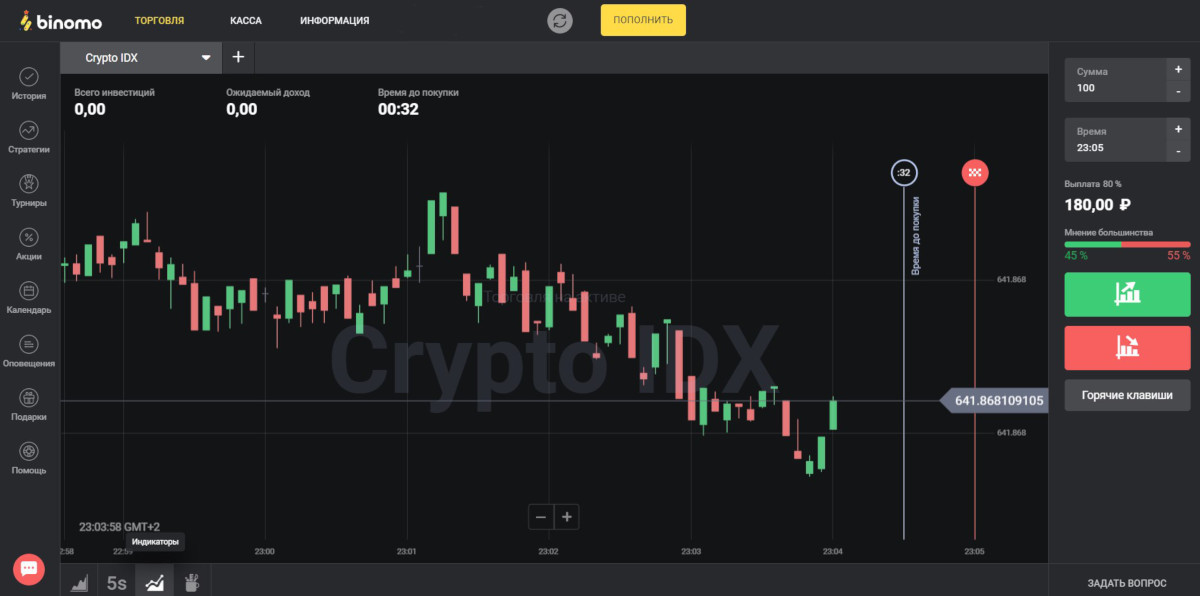
- 12 Bollinger Band Signals in Bimono
- 13 Strategies with Bollinger Bands
Description of the Bollinger Bands indicator
Bollinger bands are one of the common trending binary options indicatorswhich is characterized by a simple principle of data generation, and, of course, it is effective. It will allow you to determine the location of the value on the chart, in addition, it can also indicate its speed.
Showing information about the value, it, like other trend tools, displaying data about the range of price dynamics of the asset is located immediately in its chart. The Bollinger Bands, born more than 30 years ago, continue to be a relevant and very accurate tool, common to players of any experience with the markets (Binary options trading training). Lining up in the form of a corridor, this tool generates a lot of information, which is easy to read here: the state of the price, current moods and corrections, moments to enter.
The boundaries of the tool itself are usually located at some distance, which depends on volatility. At the same time, they change their own width, which becomes larger, expanding in the absence of stability, and decreasing, narrowing in a stable, static position. It should also be noted that the form of channels is favored by traders, it is clear and easy to understand. For example, the Keltner Channels are widely used, Envelopeswhich also in their simplicity are capable of generating a large amount of signals. The width of the Bollinger Bands changes depending on the volatility, forming a corridor in which price fluctuations can be seen.
This tool is found in a large number of strategies, complex techniques. In each case it requires a separate work with the settings and is flexible enough at that. In this case it is worth to work with the following settings: the average muving indicator – 20; the deviation parameters when drawing the borders – 2.
Log in to your broker’s terminal, add the Bollinger Bands indicator to the chart and see what comes out
| Broker | Bonuses | Open an account |
|---|---|---|
|
1
|
50 %
Bonus on deposit from $100 USD – promo code WELCOME50
|
Start |
|
2
|
5 %
Bonus when depositing via USDT (TRC20)
|
Start |
|
3
|
Cashback
Refunds of commissions, spreads and other costs
|
Start |
|
4
|
15 %
Bonus 15% on deposit by promo code iCGSbEgiAR
|
Start |
|
5
|
100 %
First deposit bonus
|
Start |
Calculation formula
The tool is based on the use of 3 lines:
MIDDLE LINE (ML) – simple sliding:
ML = SUM (CLOSE, N) / N = SMA (CLOSE, N)
top (TOP LINE, TL) – a simple average muving, but shifted upwards by any number of deviations (D):
TL = ML + (D * StdDev)
Bottom (BOTTOM LINE, BL) – the middle line, but shifted down by the same number of deviations:
BL = ML – (D * StdDev), where:
SUM (…, N) – the sum for N periods;
CLOSE – closing price;
N – periods;
SMA – a simple sliding;
SQRT is the square root;
StdDev – deviation:
StdDev = SQRT (SUM ((CLOSE – SMA (CLOSE, N))^2, N)/N).
Advantages of the indicator
As a channel instrument, Bands are especially popular with players. It is not necessary to have a serious knowledge of market theory in order to understand their readings. binary options trading. They are easy to interpret, to work with the data generated in the space of the bands themselves. They are applicable to trading on different timeframes, with different instruments. Therefore, even beginners can work with them, but they are popular first and foremost with experienced investors.
As with Envelopes, it is commonly assumed here that prices remain within a certain channel. The data on the relative position of the price inside this space allows not only to understand the mood of the market, but also to enter the deal profitably. So here it is possible to see trends in periods of volatility, when the “corridor” expands or, conversely, narrows. Among the distinctive features of this tool are usually the following: constant value dynamics occurring after a period of declining volatility; the ability to determine the current mood in situations where value is behind the “corridor”; the ability to observe reversals in situations where peaks and troughs behind the corridor will be followed by troughs and peaks within the corridor; the ability to use this corridor as a resistance/support levels. The tool can be used in different ways in the market, but in order to start working with real money, it is worth testing it on demo account.
In general, if you use the Bands correctly, they are, of course, a valuable tool that allows you to better understand the market, taking advantage of its data that has deep meaning. Thus, it is possible to see not only trends, but also their emergence, reversals, flat state.
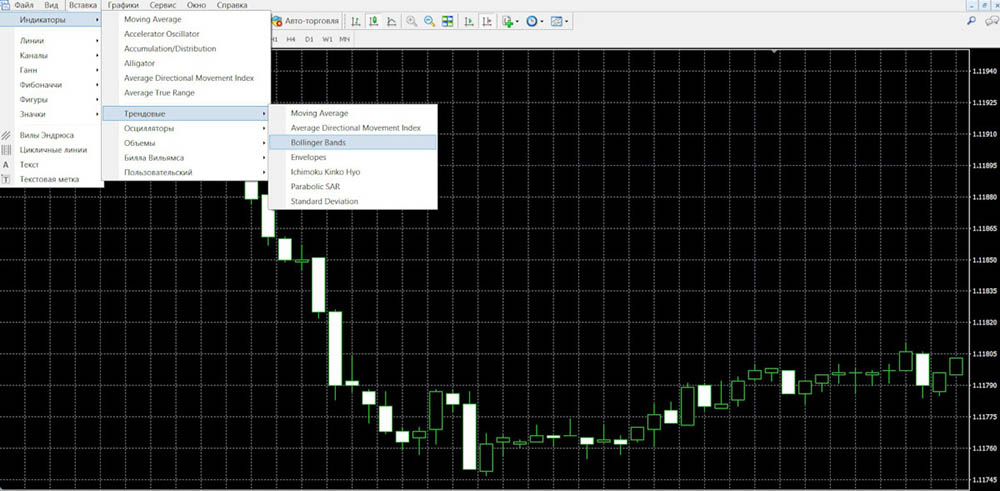
How to add Bollinger Bands to MetaTrader4?
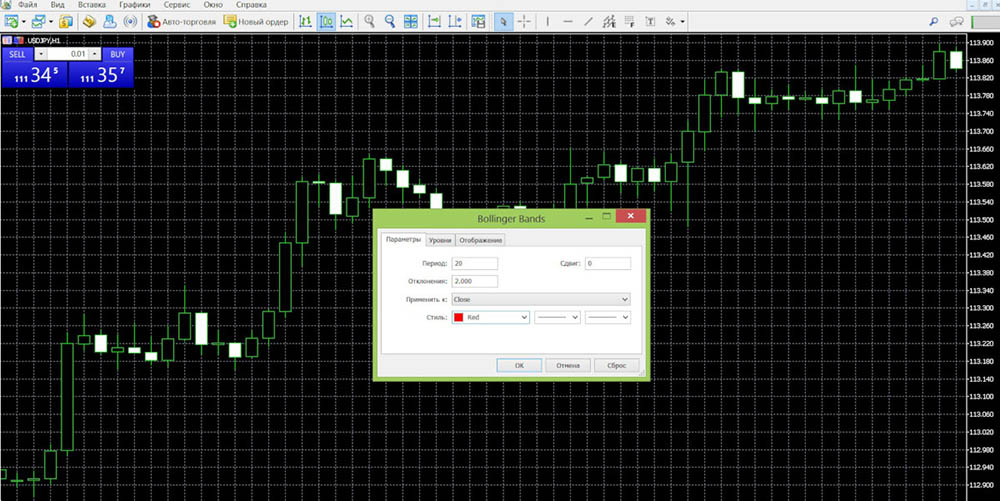
Modern trading platforms try to offer their clients the maximum possibilities for work and the list of standard tools is sometimes what influences the choice of this or that platform. MT4 is such a platform, which has earned popularity in practice. It is convenient, simple and at the same time offers many useful options for work. In addition, there are many indicators that are already installed, and they can be added to the terminal by installing a file in the system. The Bollinger Bands are also available here. To add it to the chart, you only need to find it in the list of trend tools:
Next, it is worth setting up the tool for later work:
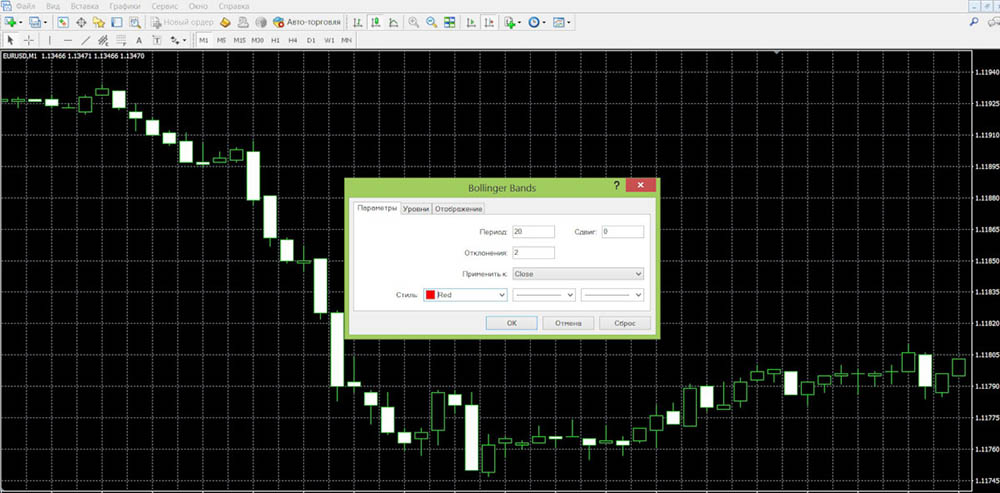
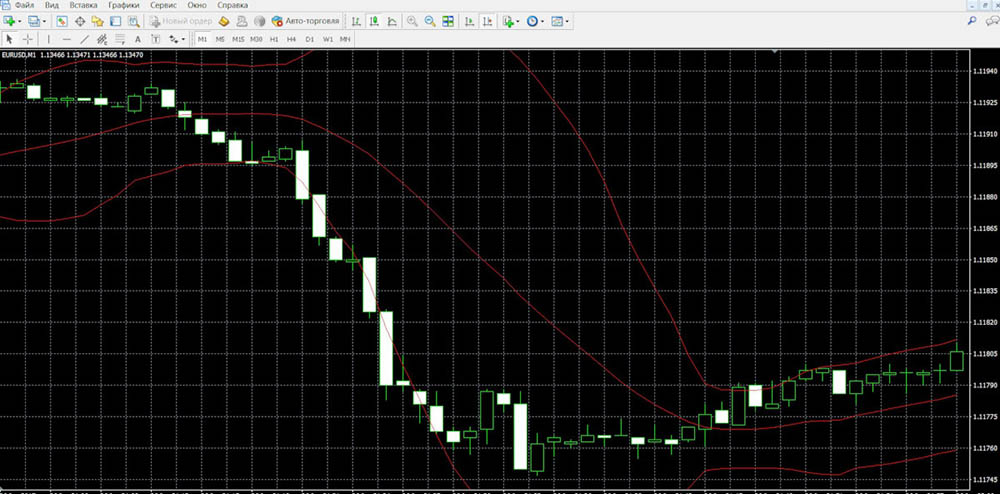
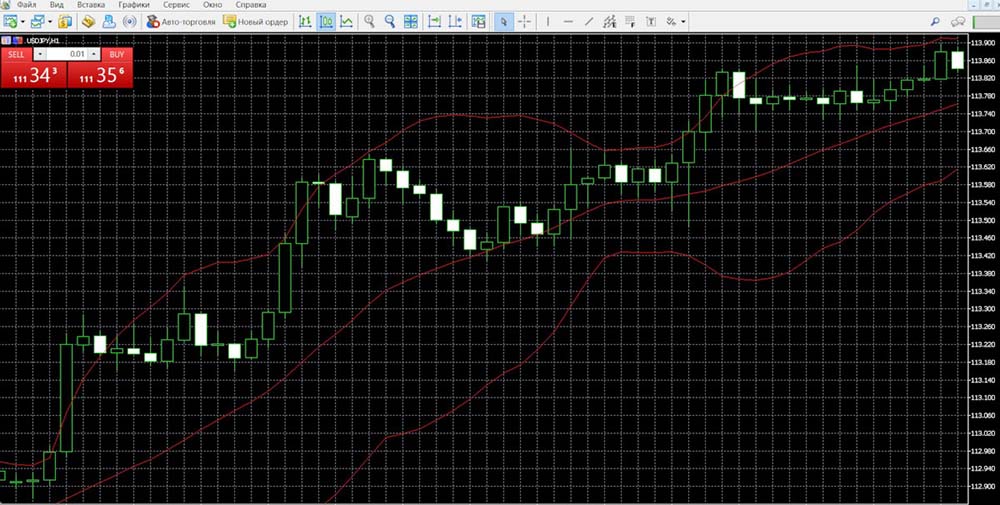
It only remains to click “OK” and that’s all – the tool is already located on the asset chart and you can start working with it:
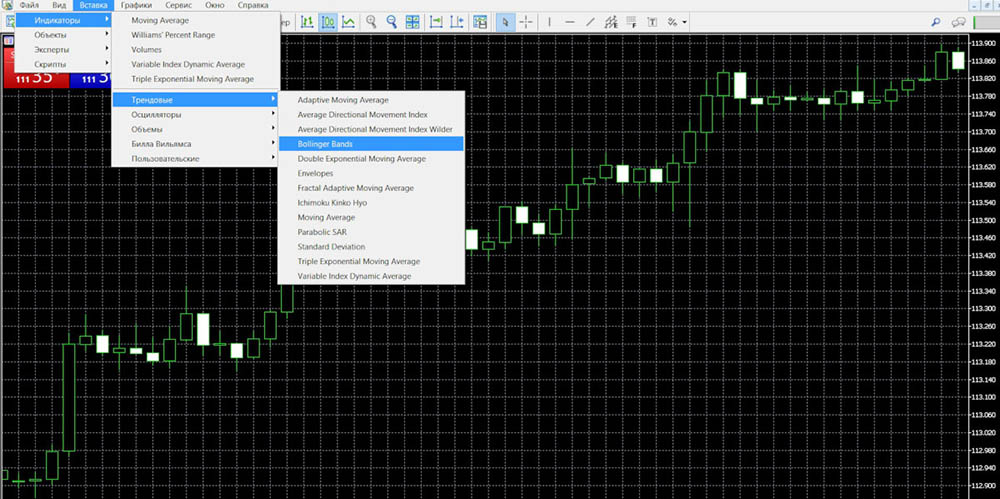
How to add Bollinger Bands to MetaTrader5?
Like MT4, this is the platform that has become popular with players. It retains all the advantages of the previous platform, but adds even more useful options, including basic tools. The Bollinger Bands are also present here and you can see that by going this way in the platform’s menu:
By clicking on the tool name, you can make the required settings depending on strategies:
Having prepared the tool for work, it only remains to add it to the trading chart by pressing the “OK” button:
How to add Bollinger Bands to the broker’s terminal?
- Finmax
This brokerage company offers one of the most powerful terminals in which a lot of possibilities for work are available. Including, there are also 4 indicators, the number of which, according to the broker, will increase. You can view the list of these tools by clicking the appropriate button immediately in the main trading area:
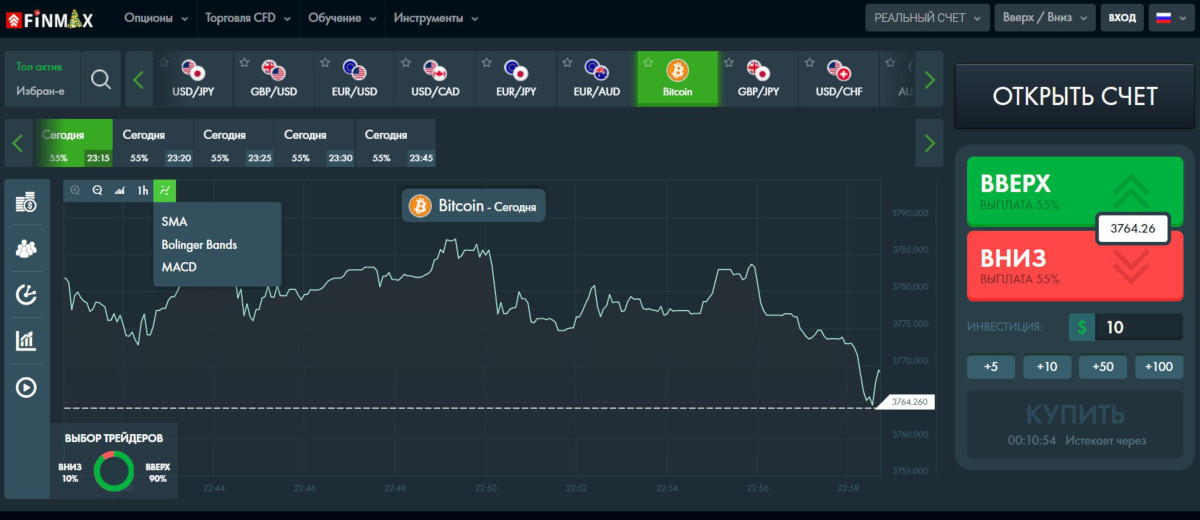
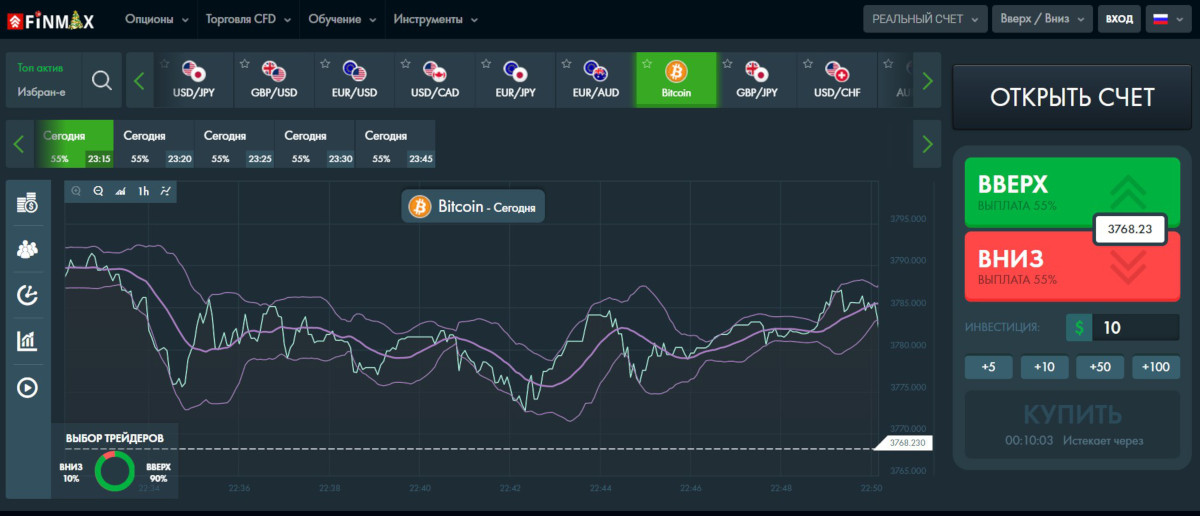
By clicking on the name of one of the instruments, you can immediately add it to the trading chart. At the same time on the platform it is impossible to work with the settings of the instruments, which limits the client’s options:
This brokerage platform has one of the functional terminals available, which also contains basic tools: these are graphical elements, a large list of indicators. To get acquainted with the indicators offered here, you can click on the same-name button, located for convenience immediately in the main workspace of the platform. In the list of indicators you can select the one you want to work with and, by clicking on its name, add it to the chart:
Here you can also conveniently work with its settings, which are instantly displayed in the main workspace of the platform:
After completing all the settings, you just need to minimize the settings panel and the list of tools and that’s it – you can start working:
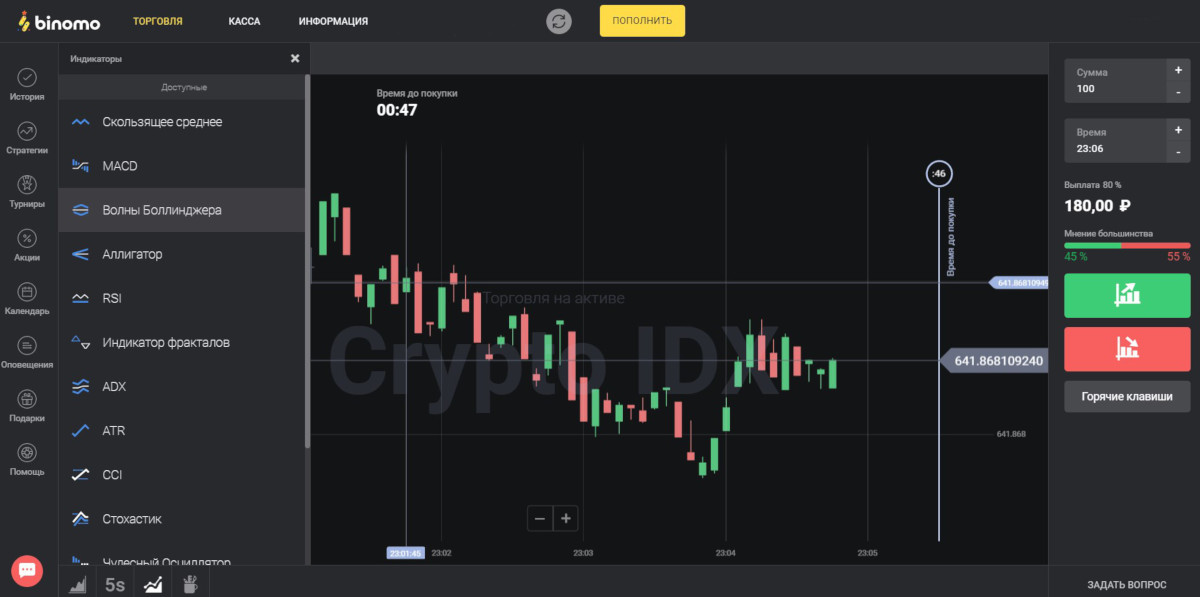
This brokerage company not only does not lag behind the platforms we mentioned above, but is even ahead of them in that its terminal is a powerful product that features a large set of standard tools, but the program is simple and does not require additional time to learn its features. Of course, and a lot of positive reviews about Binomo is a real proof of the company’s serious attitude, its success. The list of basic indicators is available at the very bottom of the platform, and to familiarize yourself with it, you need to click the same-name button:
Clicking this button opens the list of tools available here:
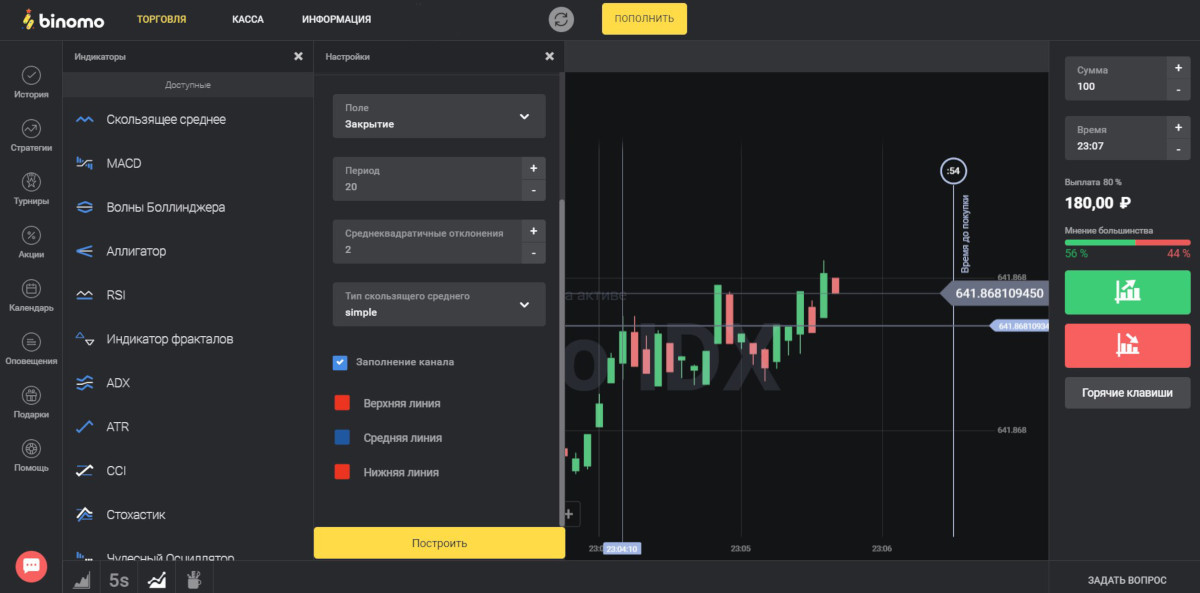
You can make adjustments to the tool:
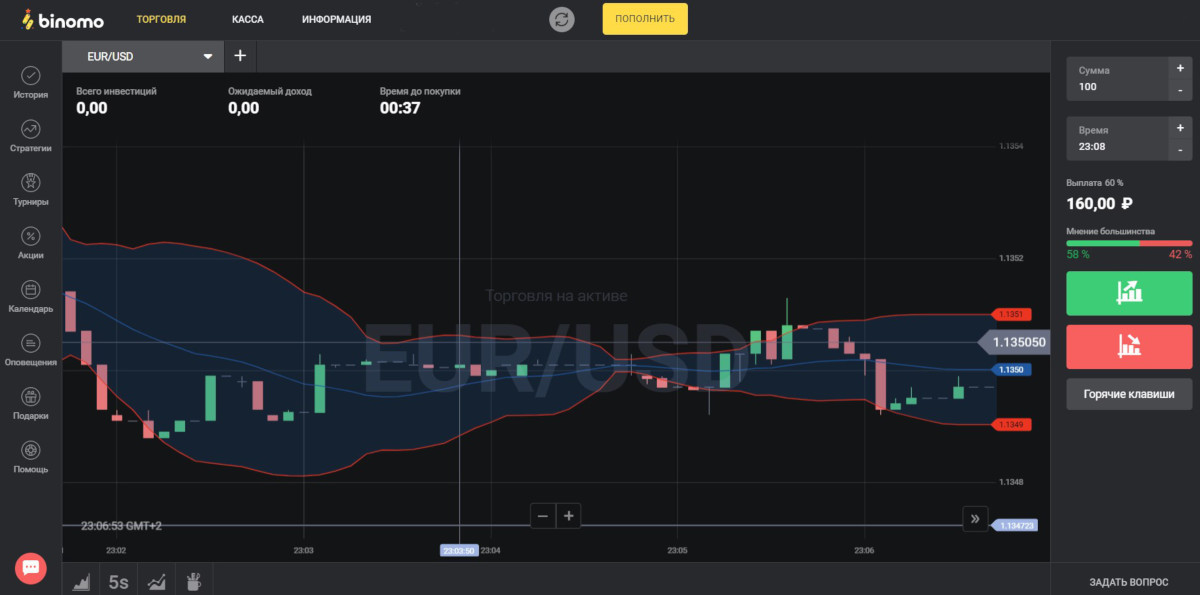
And then, add it to the main workspace using the “Build” button:
How to install the indicator in the terminal?
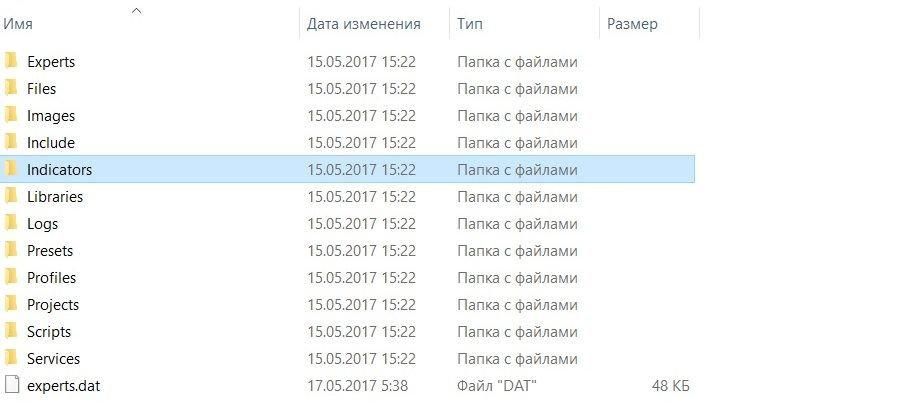
Today’s players make extensive demands on platforms, and for good reason – it is the terminal that largely determines the success of their work. And the list of basic instruments here is also something that can either attract or, on the contrary, discourage players from the program. Of course, especially popular in such programs is the option to add new instruments to the platform, which gives the player almost unlimited possibilities for work. Bollinger Bands are usually available on platforms, but it may be that this tool is not present in any program. In that case, if the platform has an option to load instruments into the terminal on the player’s side, you can add Bollinger Bands to it. In the MT4 platform, this is done very simply. Having found the file of the Stripes in the Internet or having downloaded it from our site, it is necessary to add it to the data directory:
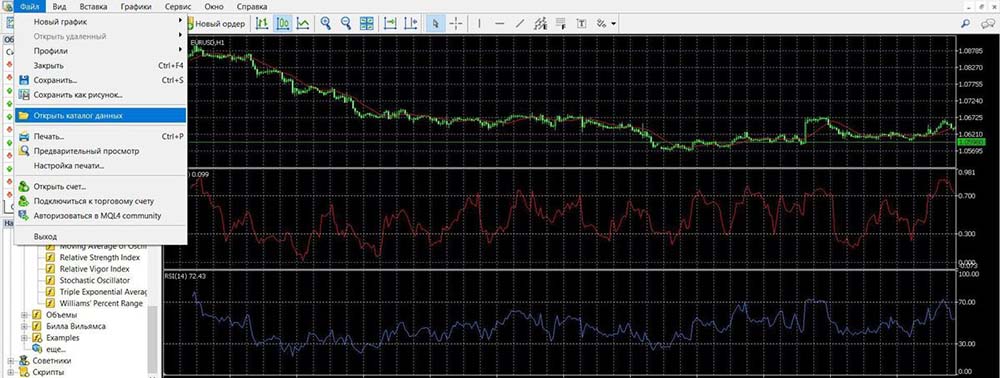
Clicking on this section, in the folder that immediately opened on the screen, you need to navigate: “MQL4” – “Indicators”:
Here are all the program tools that are already installed here:
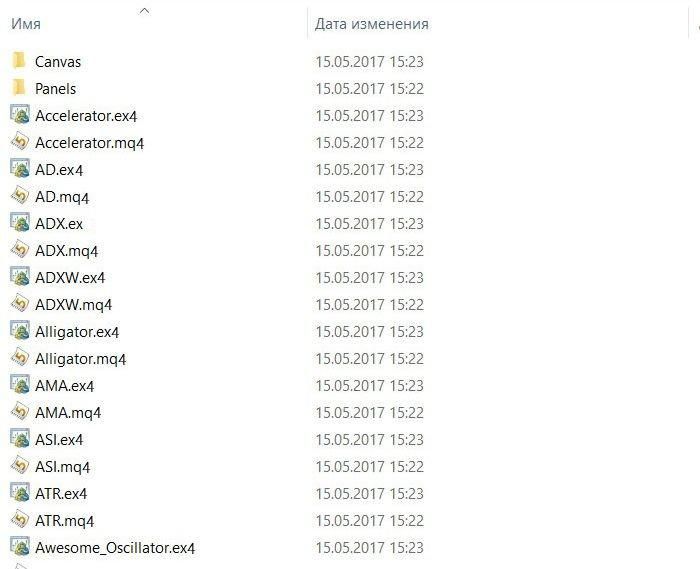
Having copied the file of the desired tool here, you can restart the program (just close and restart the software), check whether it is displayed among the custom indicators, add it to the chart:
Bollinger Band Trading Signals
Overbought/oversold:
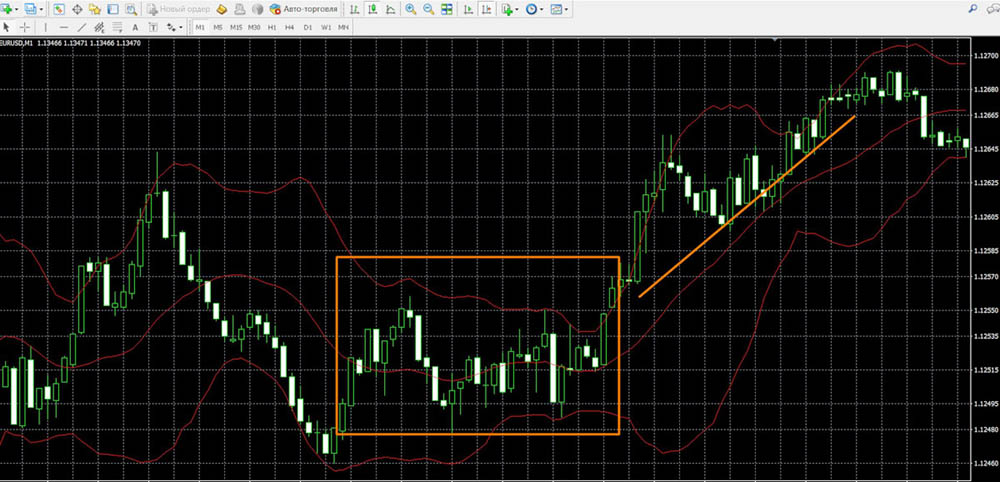
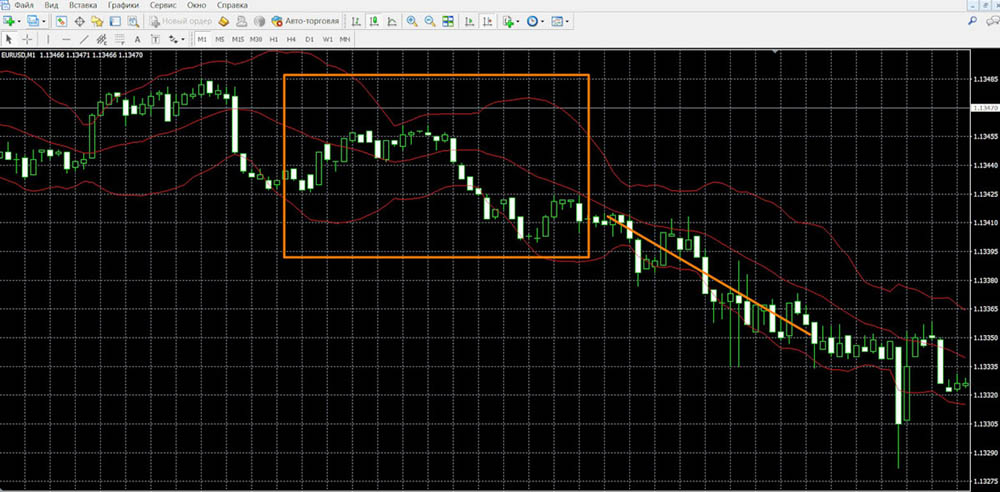
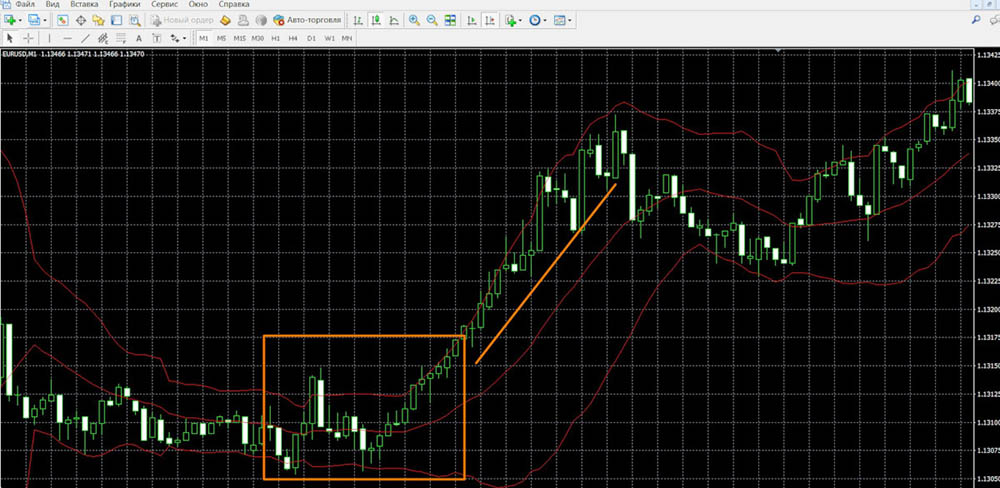
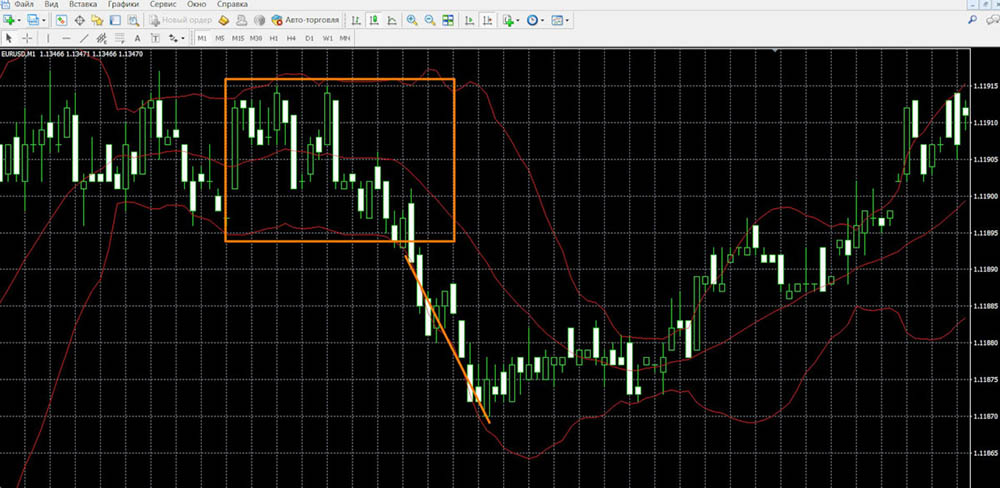
- If the price reaches or crosses the upper boundary of the Bands, it confirms that the asset is traded at a high price, so it is overbought and then, expecting a decline in interest in the asset (return to the center line), it is worth selling the contract.
- If it reaches or crosses the lower Band, it confirms that the asset is traded at a low price, so it is oversold and, expecting the growth of interest in it (return to the center line), it is worth to buy this contract.
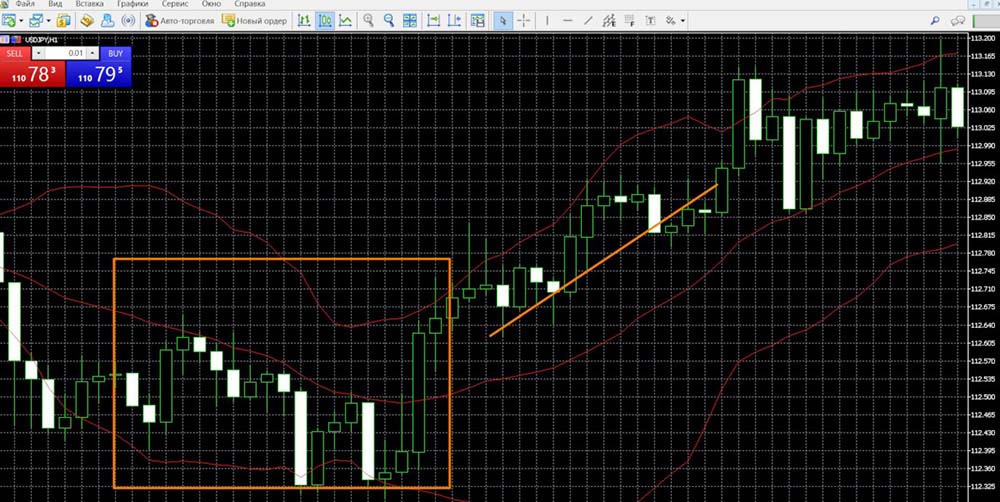
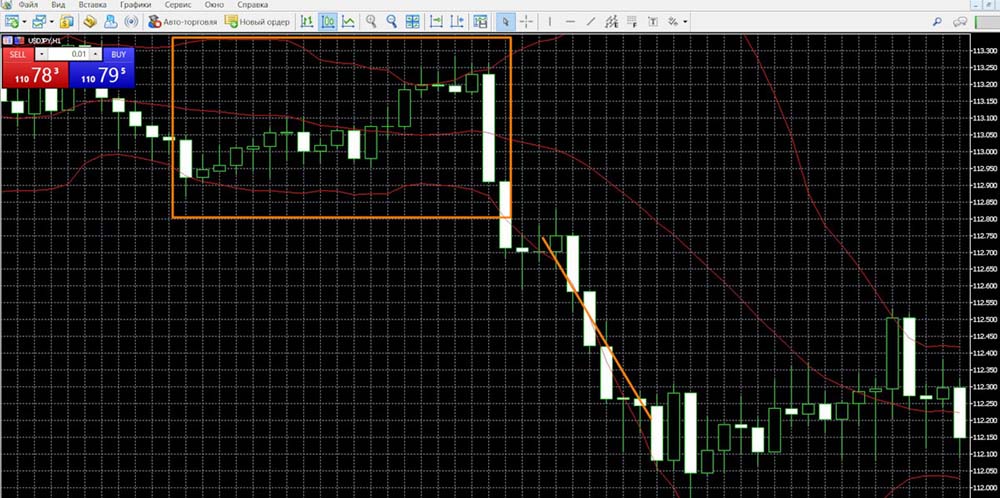
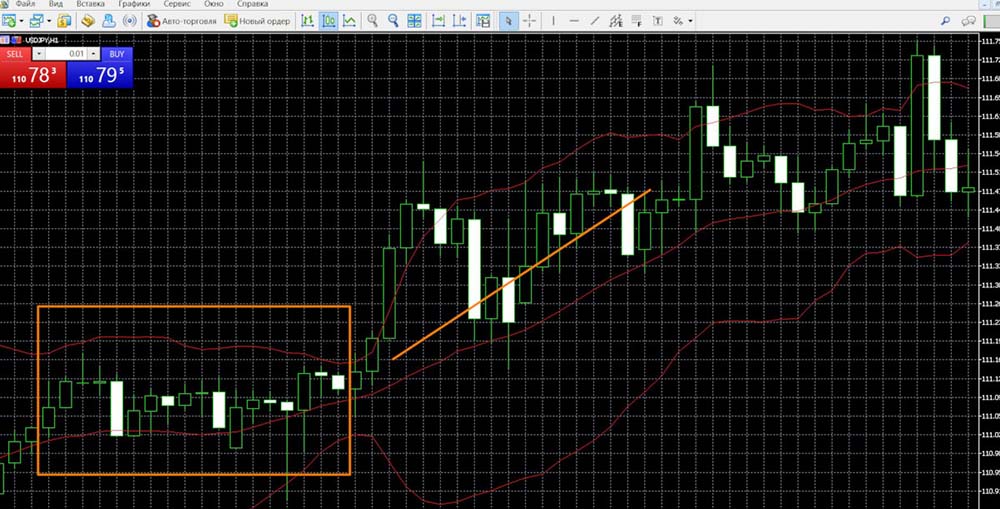
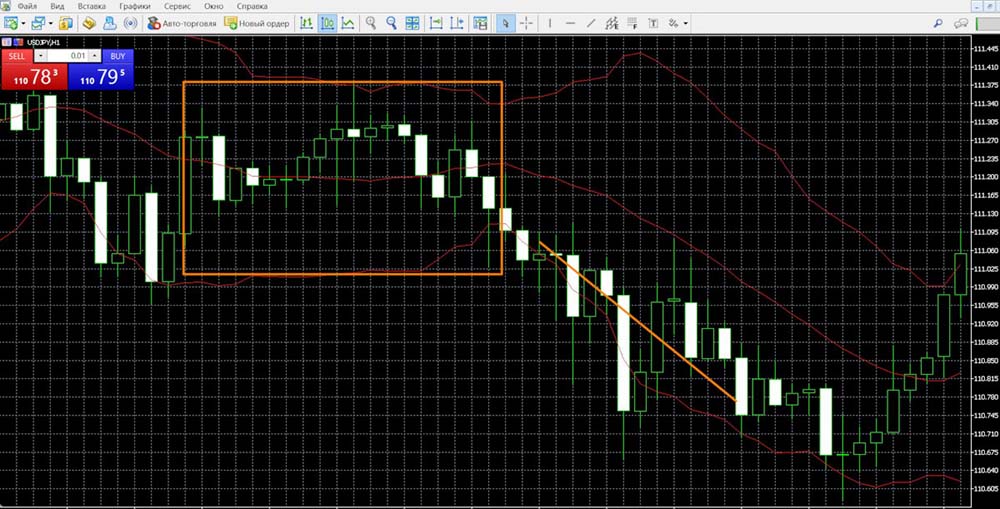
Bounce signals from the midline:
- If the price is above the midline, goes down to the midline, and bounces up from the midline, it’s worth making a KOLL contract.
- If it rises to the midline and then bounces down from it, in this case, it is recommended to execute PUT contracts.
Signals of intersection with the center line:
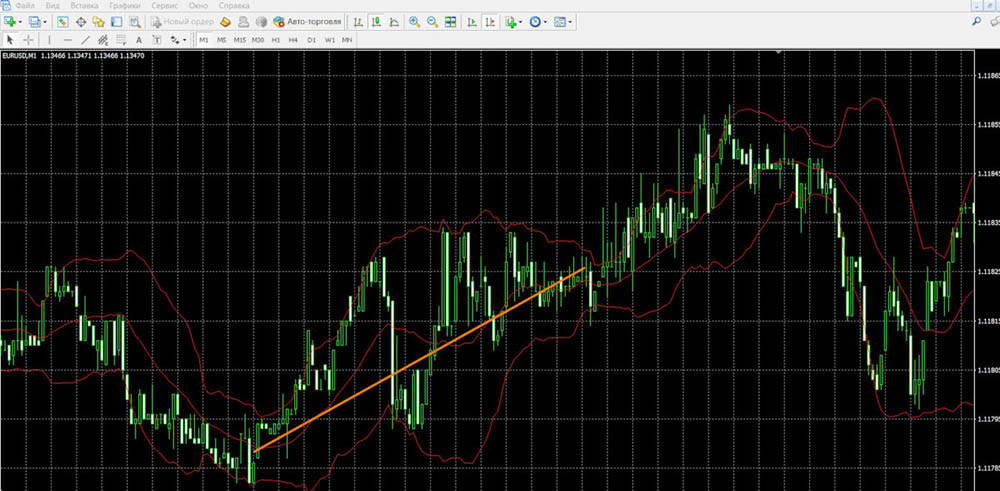
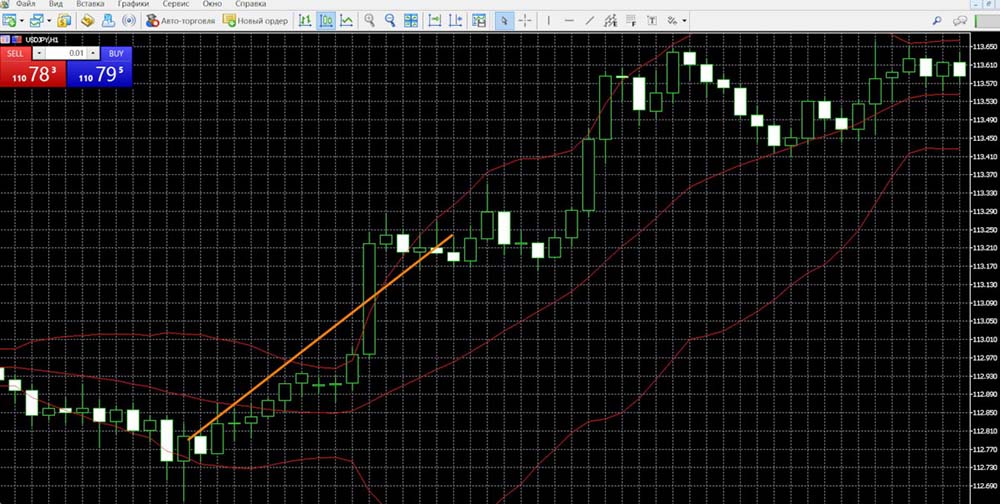
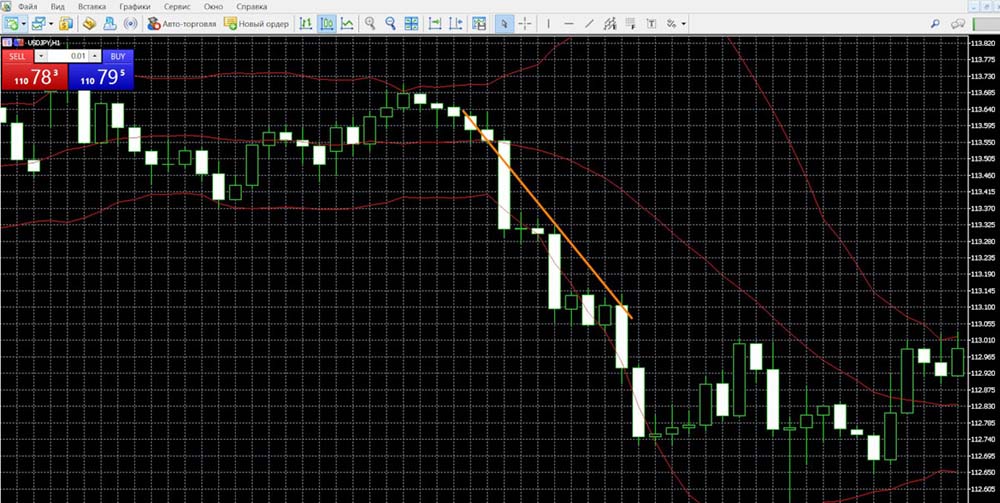
- If the crossover from the bottom to the top is shown, it is worth investing in a Koll trade.
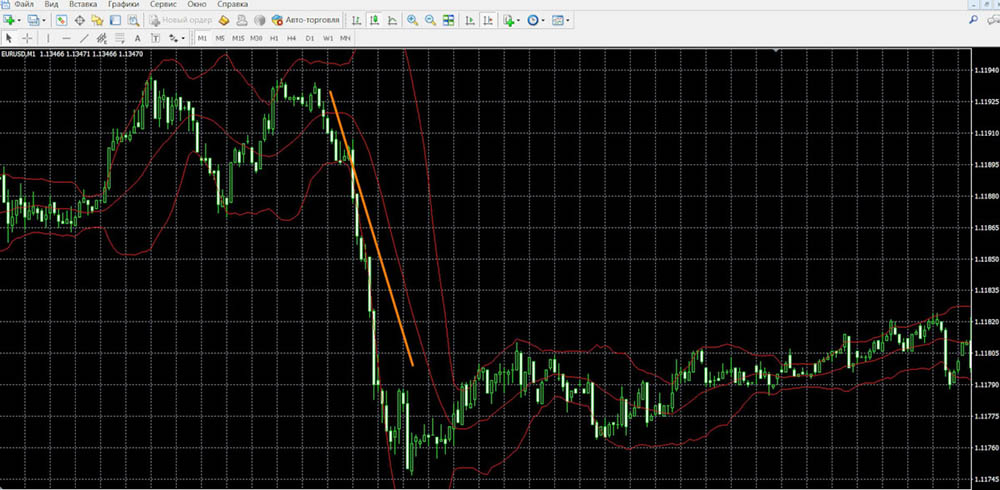
- If it happens from top to bottom, it is better to pay attention to PUT transactions.
Bollinger Band Signals in MetaTrader 4
- Overbought/oversold
Implementation of the contract is UP:
Implementing the contract DOWNLOAD:
- Bounce signals from the midline
Implementation of the KOLL contract:
Implementation of the PUT contract:
- Midline crossing signals
Registration of the COLL contract:
Drawing up a PUT contract:
Bollinger Band Signals in MetaTrader 5
- Overbought/oversold
Implementation of the KOLL contract:
Implementation of the PUT contract:
- Bounce signals from the midline
Acquisition of an UP contract:
Acquisition of a DOWN contract:
- Midline crossing signals
Implementation of the promotion contract:
Implementation of a down contract:
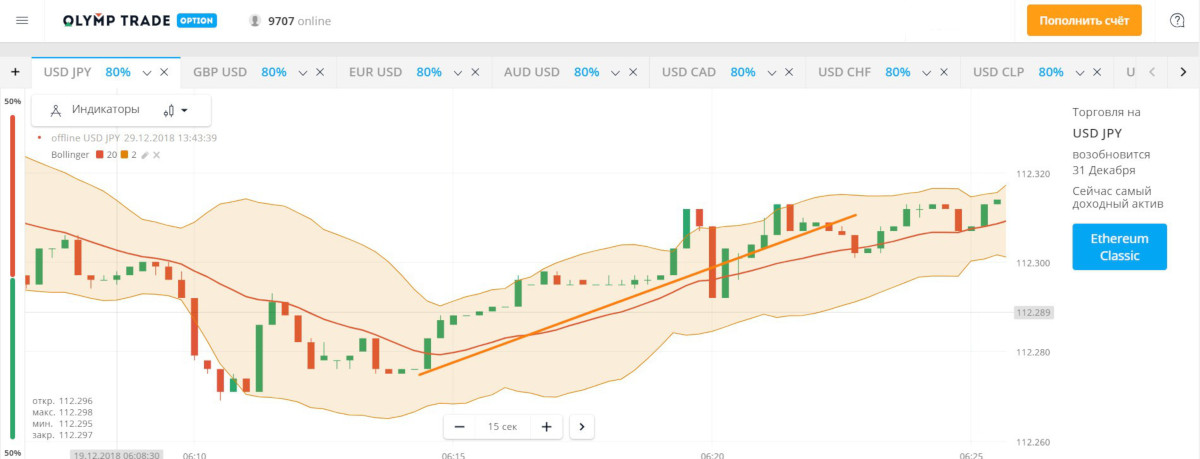
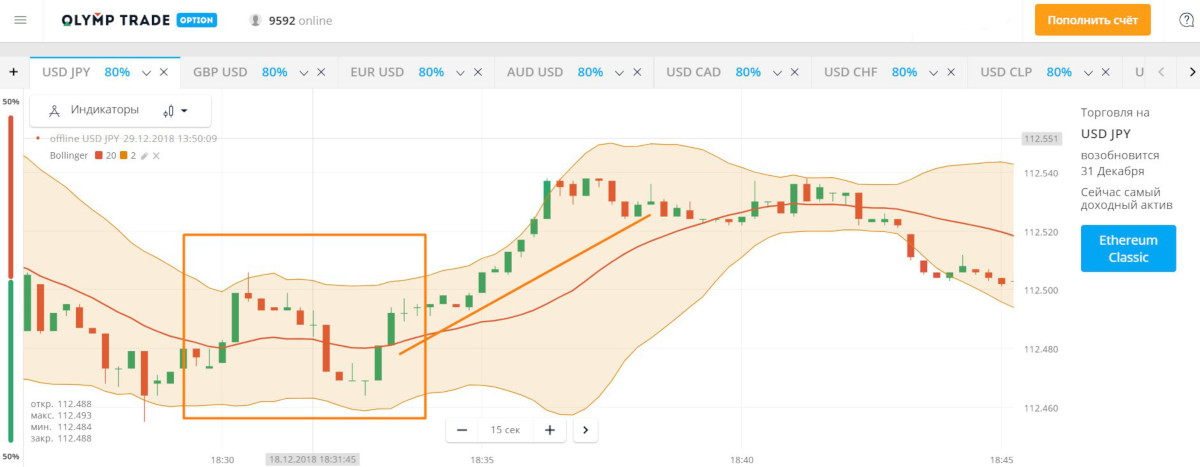
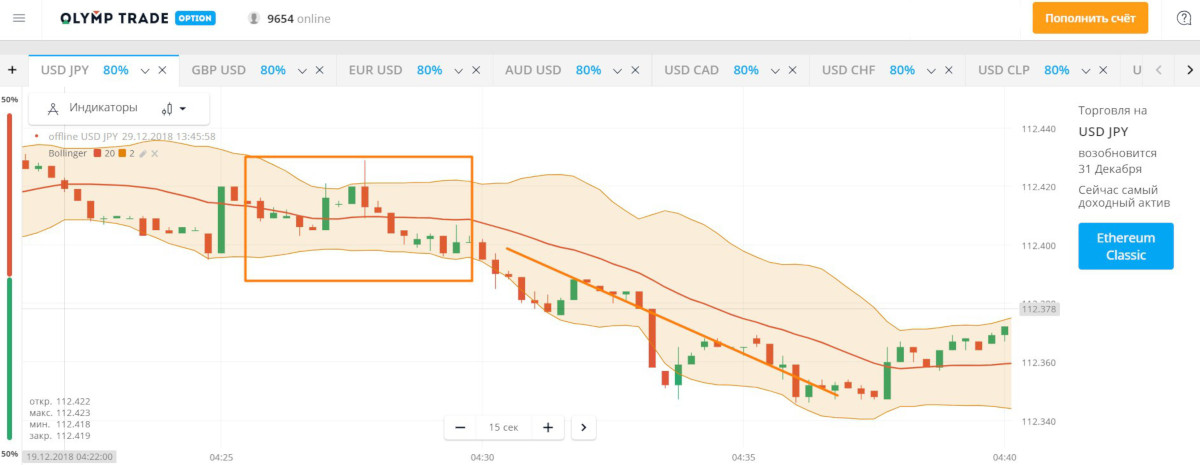
Bollinger Band Signals at Olimp Trade
- Overbought/oversold
Implementation of the KOLL contract:
Implementation of the PUT contract:
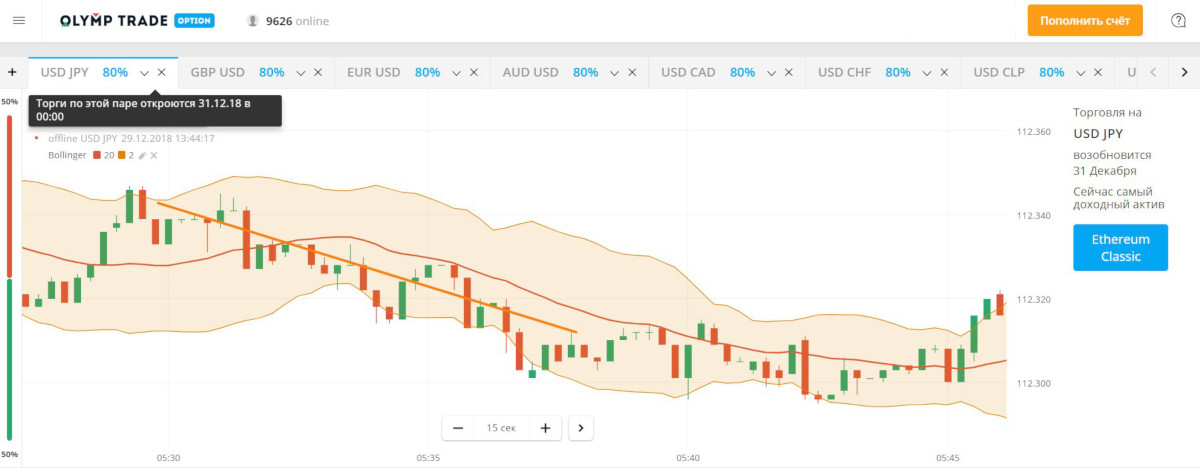
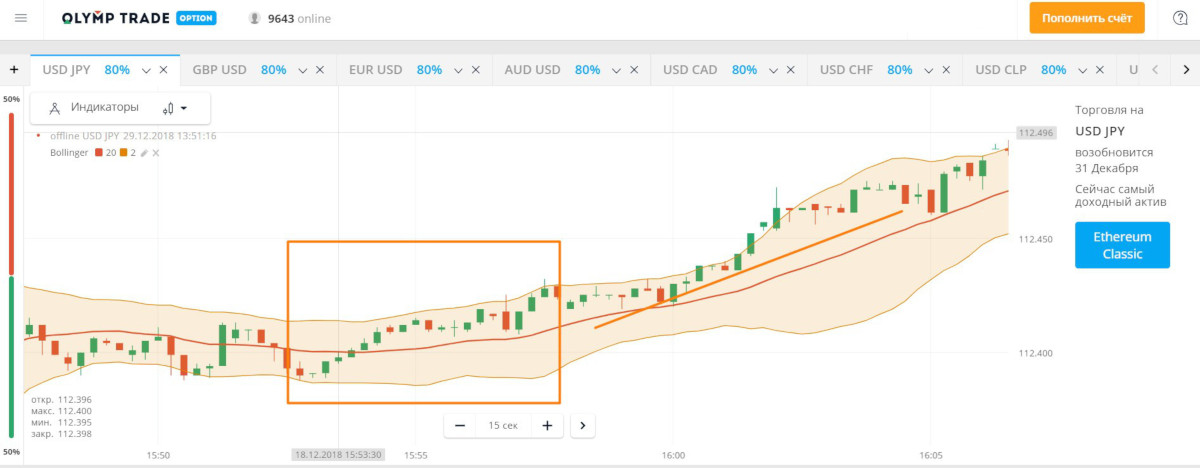
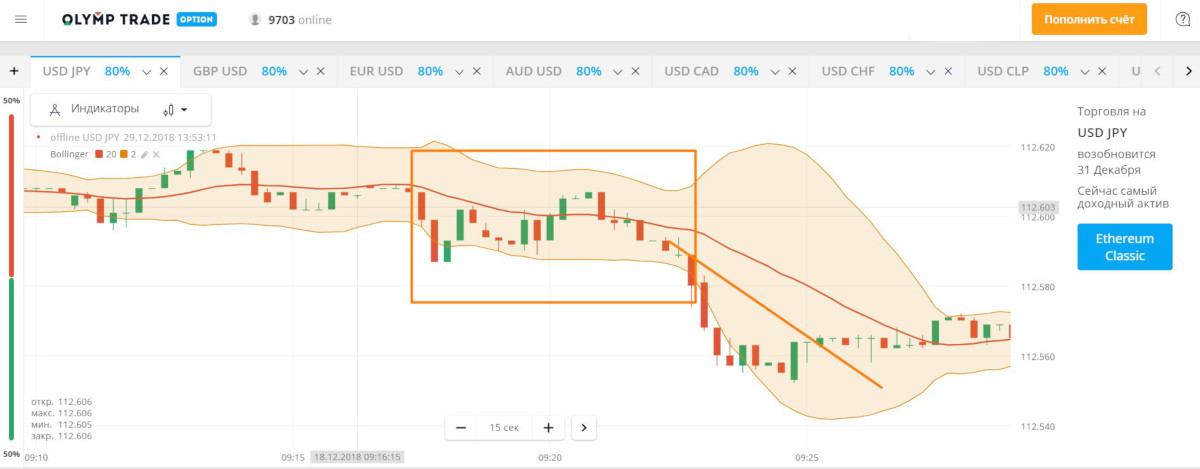
- Bounce signals from the midline
Acquisition of an UP contract:
Acquisition of a DOWN contract:
- Midline crossing signals
COLL of the deal:
PUT transaction:
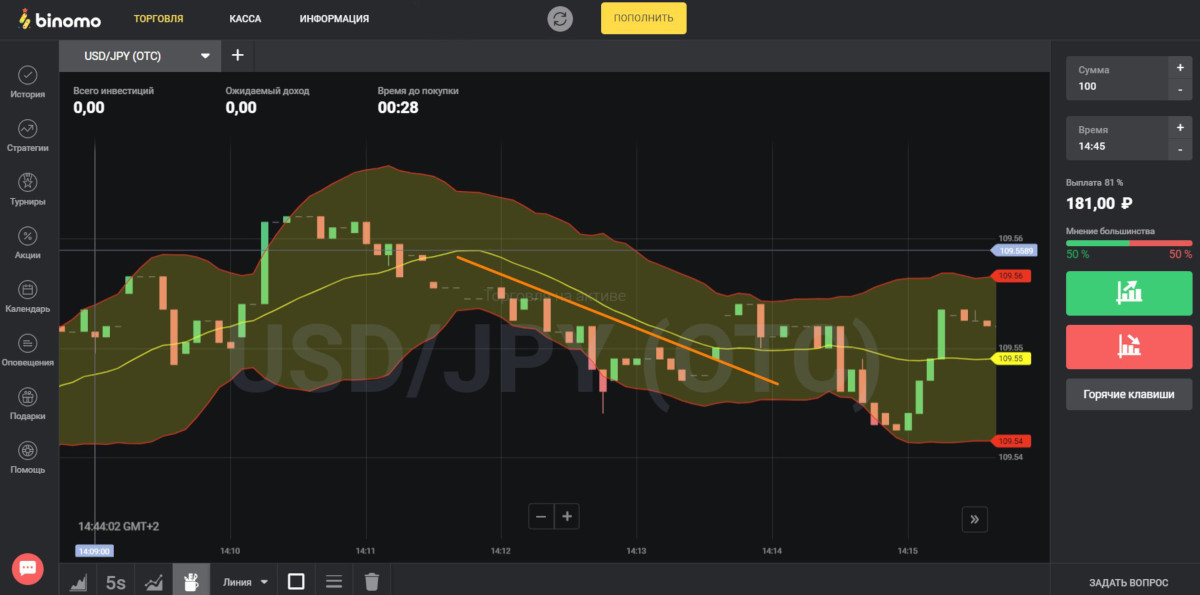
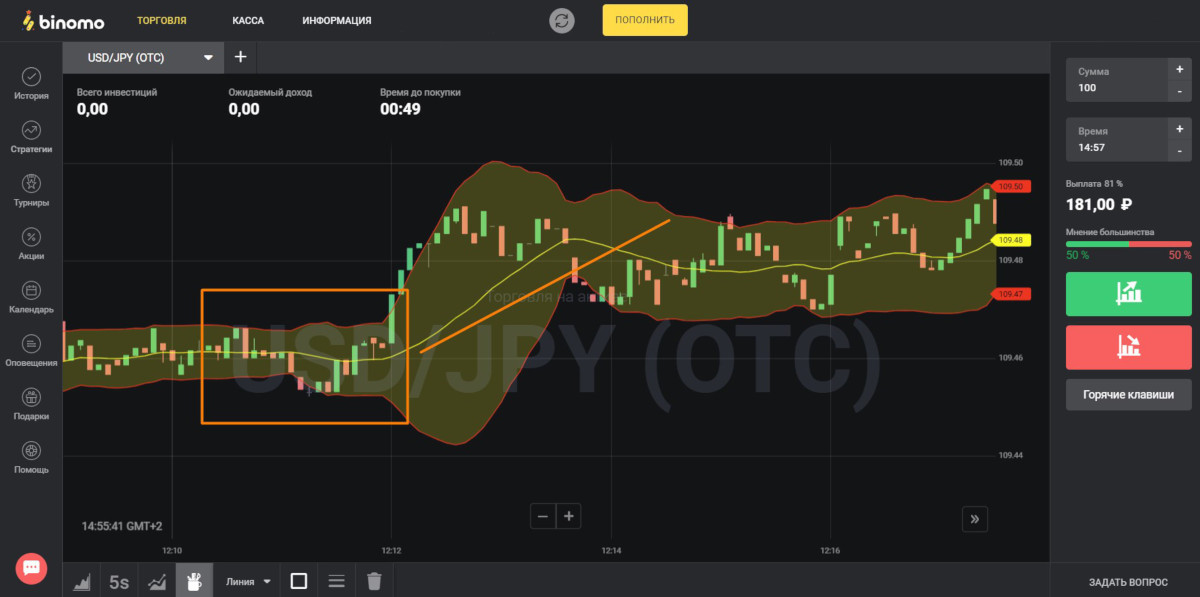
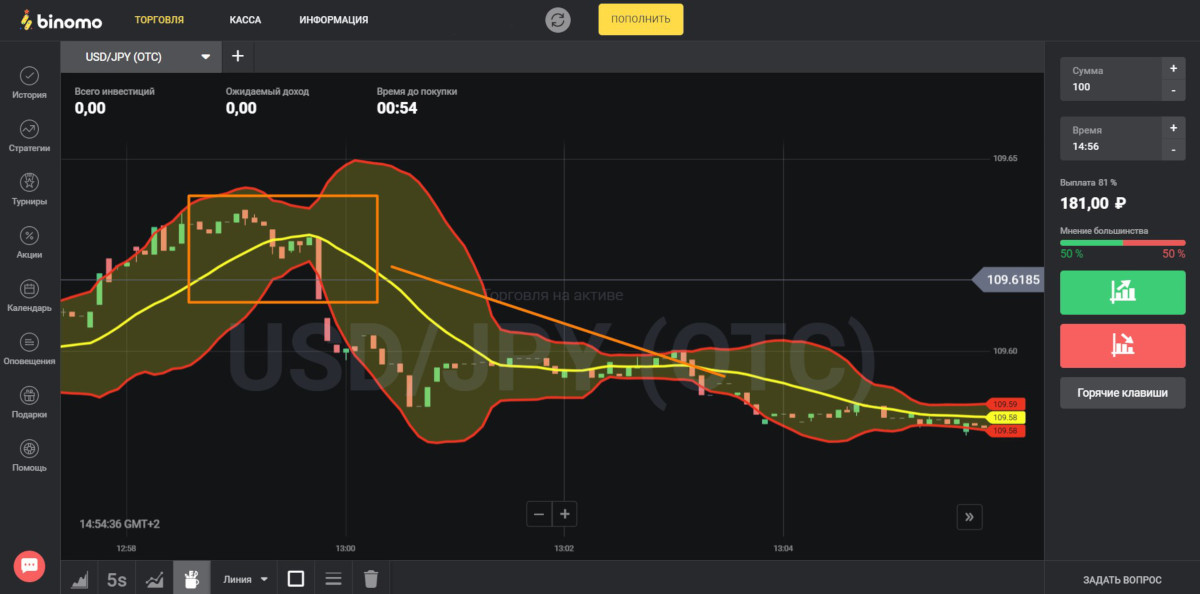
Bollinger Band Signals in Bimono
- Overbought/oversold
COLL of the deal:
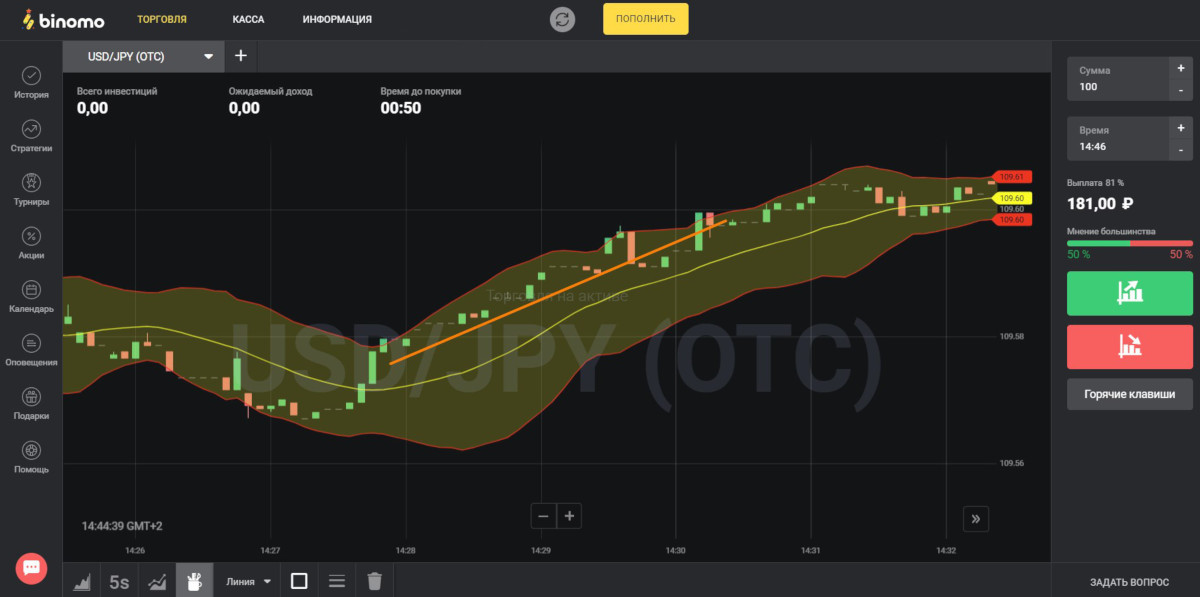
PUT transaction:
- Bounce signals from the midline
Implementation of the KOLL contract:
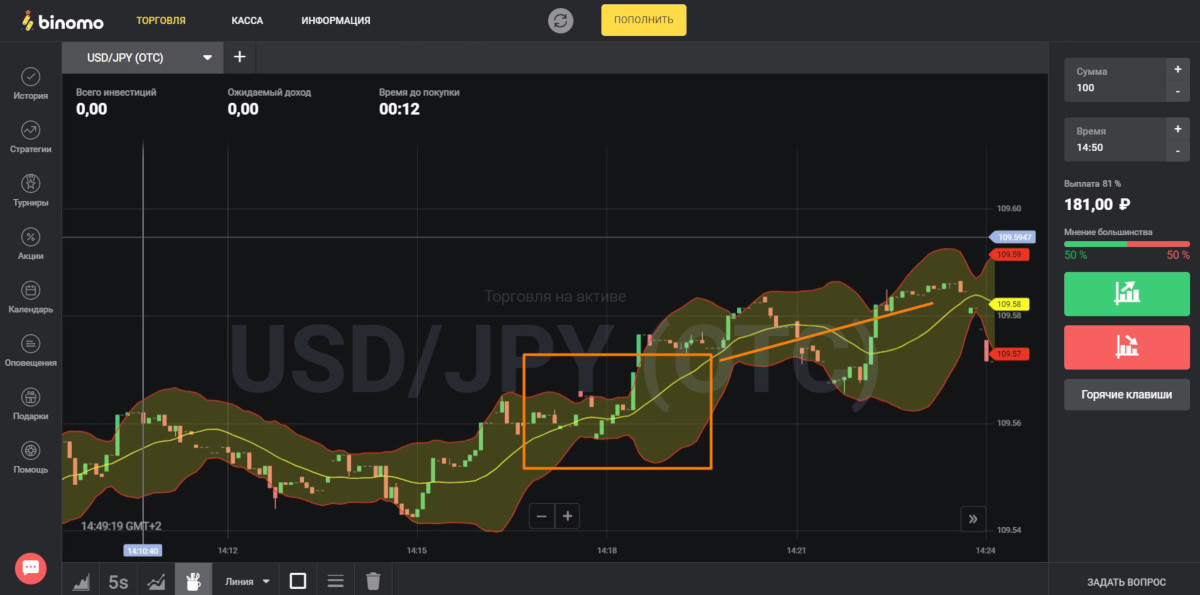
Implementation of the PUT contract:
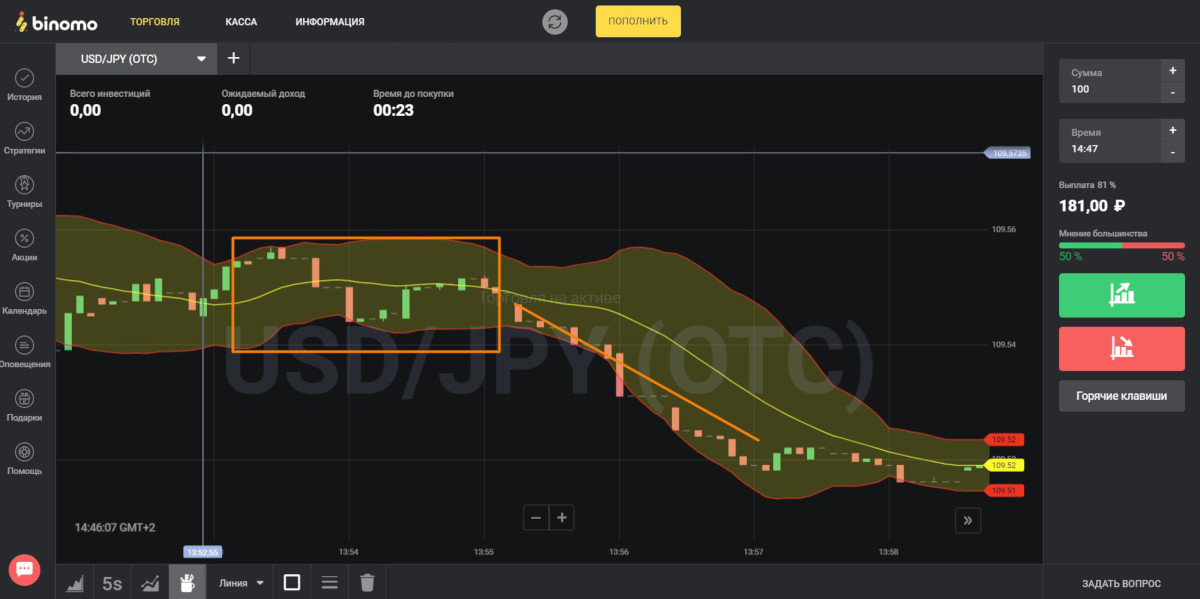
- Midline crossing signals
Placement of bets with the value of KOLL:
Drawing rates with the value of PUT:
Strategies with Bollinger Bands
This is a simple system, which is guaranteed to simplify the work of the player and therefore it is especially interesting to investors. It uses an easy toolkit that generates accurate data on the mood of the asset in this very “composition”: this is the information of the Bollinger Bands, which shows the current state of the asset, and RSIwhich acts as an auxiliary tool, filtering and correcting the Band data. For realization of the up bets it is necessary for the toolkit to demonstrate the situation, according to which the candle of green color must break the middle line of the Stripes, and the RSI demonstrates the crossing of the border zones and falls into the area OverBought. To implement the DOWN bets, it is necessary for the toolkit to demonstrate the situation, according to which the candle of red color must cross the middle line of the Stripes, and the RSI enters the area OverSold.
Another interesting and, most importantly, quite effective system that can not only optimize and simplify the work of players to study the dynamics of assets, but also really increases the amount of money in the account. It is based on the use of simple, but at the same time strong and time-tested tools: these are the legendary Bollinger Waves and Haiken Ashi Schedulewhich will allow you to work with accurate data, without wasting time on minor fluctuations in value. This chart is ideal for tidal wave trading, the system result is greatly improved with Bollinger Bands.
For execution of contracts DOWN the system should show the situation, according to which the value should be at the top border of the Bands, then, having touched or broken it, return to the framework of the Bands; then the candle Haiken Ashi red color crosses the middle line of the channel. When the bar of the lower half of the Bands closes, you can place a bet. For the execution of contracts DOWN, the system should show the situation, according to which the value is reflected in a similar way, but from the lower boundary of the Stripes, the confirmation of the signal is by breaking the candle of the middle line.
The system offered here is capable of improving the results of any asset. Thanks to its method of predicting market sentiment, you can easily get accurate data for stable trading, providing growth of funds over 80%/session. The value of this technique is the use of reliable tools: Vdub Renko SniperVX1 v1, built on algorithms to study the mood of the asset, using sliders, Bollinger Bands, Renko candles, they are used where it is important to see the full amount of data on the asset and obtain accurate predictions, also another powerful system, AK MACD BB v 1.00, which uses data MACD and the same Bands, which gives the player the opportunity to work with accurate data on the reversal of trends.
To purchase a contract for growth, the following picture must be shown: the price must cross upwards Vdub Renko SniperVX1 v1, then it must be crossed by the slips and the system must show BUY and AK MACD BB v 1.00 must cross upwards by the dotted line of the Bands. To buy a down bid, the following picture must be shown: price must cross down Vdub Renko SniperVX1 v1, then it must be crossed by the slips, the system must show SELL, and AK MACD BB v 1.00 crosses down the Bands.
30-minute bets are more popular with system players, who care about the stability of profits. Here the risks are reduced, the work takes place in optimal conditions, and it is not difficult to determine the mood of the market. On the time charts of such a duration, the broad borders of the market are evaluated, so you can get clear information about the trends. The system we offer here helps to work effectively with such contracts and get accurate signals. The template of this technique is based on the use of such tools: Least Square Moving Average, necessary here to find long trends and at the same time increase the efficiency of the system; Bollinger Bands, a high-tech oscillatorIt evaluates reversal boundaries as well as extrema, determining at the same time some valuable data for work; also it is UCS_ Stochastic Momentum Index, a powerful service with precise reaction on the moments of extremum reaching the value, able to determine impulses of quotation dynamics.
In order to place an upside bet, it is necessary to identify data signaling an upward mood: the price must cross the Least Square Moving Average upward; the Bands mooving, after turning from oversold, must cross upward the 0.5 line; the UCS_ Stochastic Momentum Index, showing the crossing of the moovings upward, gives the player the main signal to enter the bet. To purchase DOWN bets, it is necessary to identify data in the system that signals a downward mood: the value should cross downward Least Square Moving Average; the Bands line, having reversed after overbought, should cross downward the 0.5 line; UCS_ Stochastic Momentum Index, showing the crossing of the moving averages in the down direction, has generated the moment to enter the bet.
Another example of a productive system with Bollinger Bands. Due to the fact that this tool, as well as CCIThe CCI, which provides two levels of filtering data on asset sentiment, provides players with highly accurate data for investment. To buy DOWN contracts, it is necessary to identify the following indicators in the system: CCI must go beyond the upper limit, in addition, the green candle goes beyond the upper Bollinger Band, the close point of the candle is above the Bands, you can make a bet after that. To purchase contracts upwards it is necessary to identify the following indicators in the system: CCI must go beyond the lower limits, in addition, the descending candle goes beyond the bottom Bollinger Band, you can make a bid here immediately at the opening of the candle.