Trend Trading Strategy for Binary Options
One of the basic rules of technical analysis is the condition that trade should always be conducted by the direction of the main trend. However, even here we do not need extremes, because the best time to enter the market is a reversal of trends. Trading by trend Binary options implies the timeliness of entering the market, so that the period of the transaction touched at least the last momentum of the movement, which will allow you to make a profit.
In this article we will look at trading strategy trend with the use of two indicators – “MACD Crossover” and “Supertrend V1.0 – Buy or Sell Signal”. The first tool is a custom version of the legendary MACD with an adjusted averaging formula and a changed appearance. The second indicator is trend linewhich will make it possible to determine what state the market is in.
Review of indicators for trend trading
MACD Crossover – instrument, which consists of two curves with fast and slow period. The indicator does not differ fundamentally from the classical version, so we will not delve into the technical nuances. The slow curve has a red fill color, the fast one – blue. Their intersection is trading signal. The blue line indicates the direction of the trend. If it comes out on top of the second moving averageThe price is increasing, it is falling down the red line – a downtrend.
Supertrend V1.0 – Buy or Sell Signal – arrow indicator developed by the TradingView user. It allows, firstly, to instantly determine which type of trend is active, and secondly, with its help market reversal points are determined. The tool represents a single curve line, which changes its color depending on the type of trend. Price rises – green, falls – red.
Moments of crossing price formations with the moving average are marked by arrows, which indicate the direction of the trade. However, in this strategy, the MACD Crossover is the main indicator and the Supertrend acts as an auxiliary filter. Therefore, the arrows can be turned off in the TradingView chart settings (go online). To do this, you need to uncheck the “Up Arrow” and “Down Arrow”, as well as the “Up Entry Arrow” and “Down Entry Arrow” in the indicator parameters. And it is better to maximize the thickness of the line, so that it can be better seen on the chart.
Signals for strategy
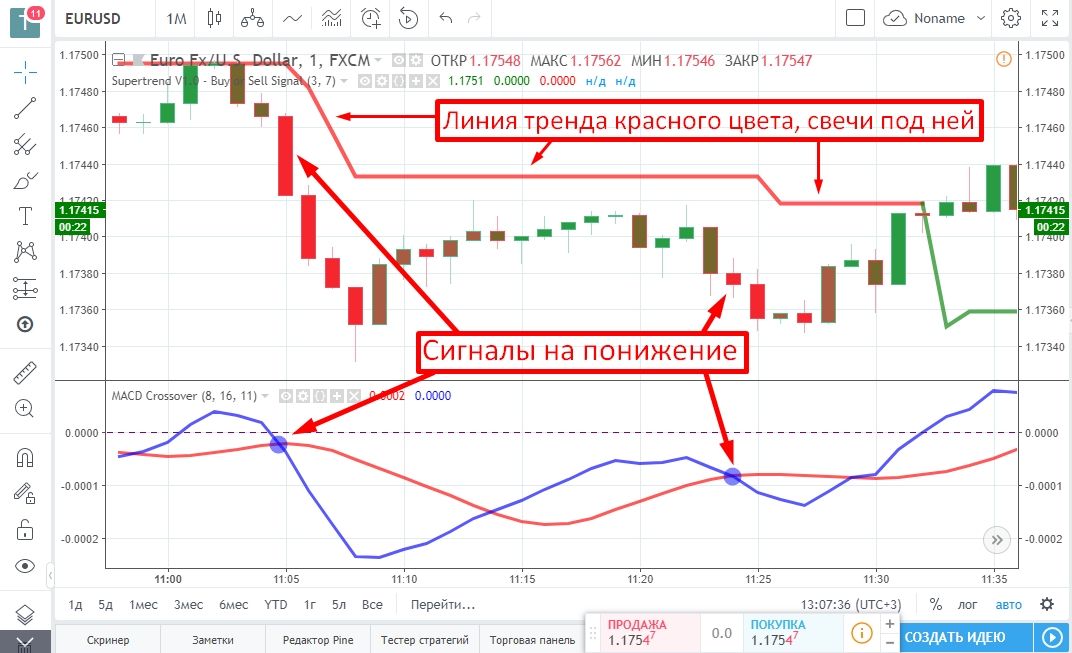
The principle of the system is very simple. You should mainly be guided by the MACD Crossover signals. If a crossover occurs, as a result of which the blue curve has fallen below the red one, you should buy a contract to go down.
However, you can follow the signal only if the general trend in the market is downward. The second indicator – Supertrend V1.0 – Buy or Sell Signal will help us in this. The line should be colored red and the candles on the chart are plotted below it by level.
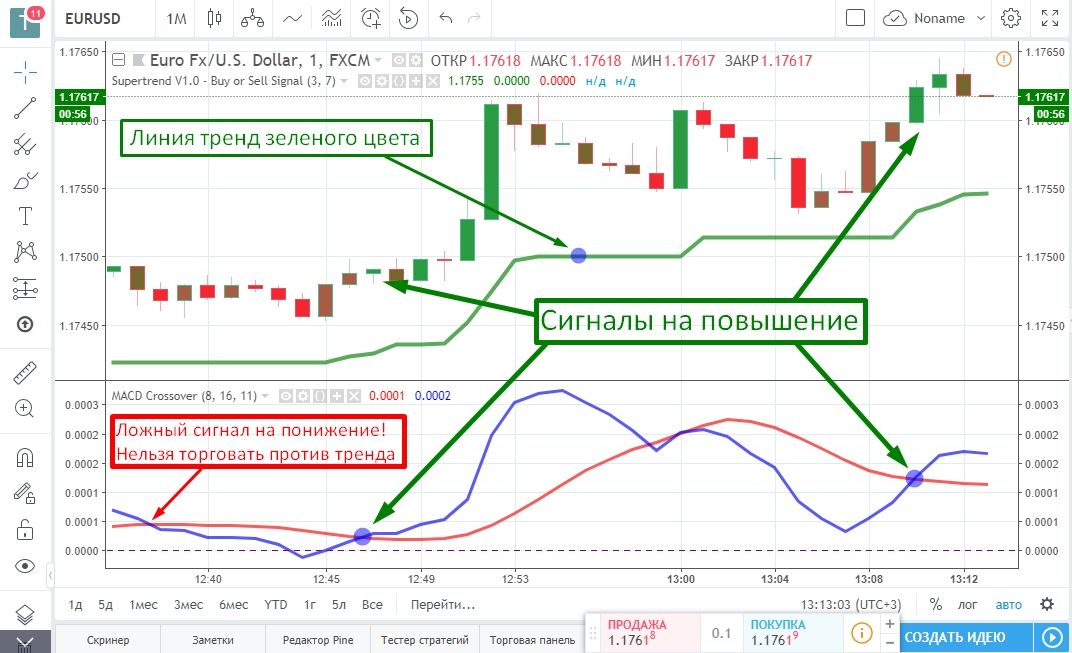
The signal to go up is similar. It is a crossover of the MACD Crossover curves for the slow moving average (blue) to go up. The signal must necessarily be confirmed by the second indicator, which is a filter. Only the trend can be traded. Accordingly, the Supertrend curve should have a green fill color and be located below the price bars.
The example above also shows an example of a false down signal from the MACD Crossover, which can be easily filtered out. This is a clear demonstration that using two instruments simultaneously increases the overall effectiveness of the trading system.
Trading rules
The duration of a single trade on this strategy should be 2-3 minutes on 60-second charts and 10-15 minutes on the 5-minute. The functionality of the trading INTRADE.BAR platforms supports these timeframes and expiry dates. The size of investment is limited by the rules of Capital Management. It is established that the optimal deal size for trading on the futures markets is up to 1% of the deposit, the maximum allowable – 5%.
An important nuance is the duration of the trend, in the direction of which the trade is conducted. The closer to the turning point the market entry is made, the better in terms of the probability of passing the signal. However, there are exceptions in the form of very long directional trends.
Trading by trend strategy
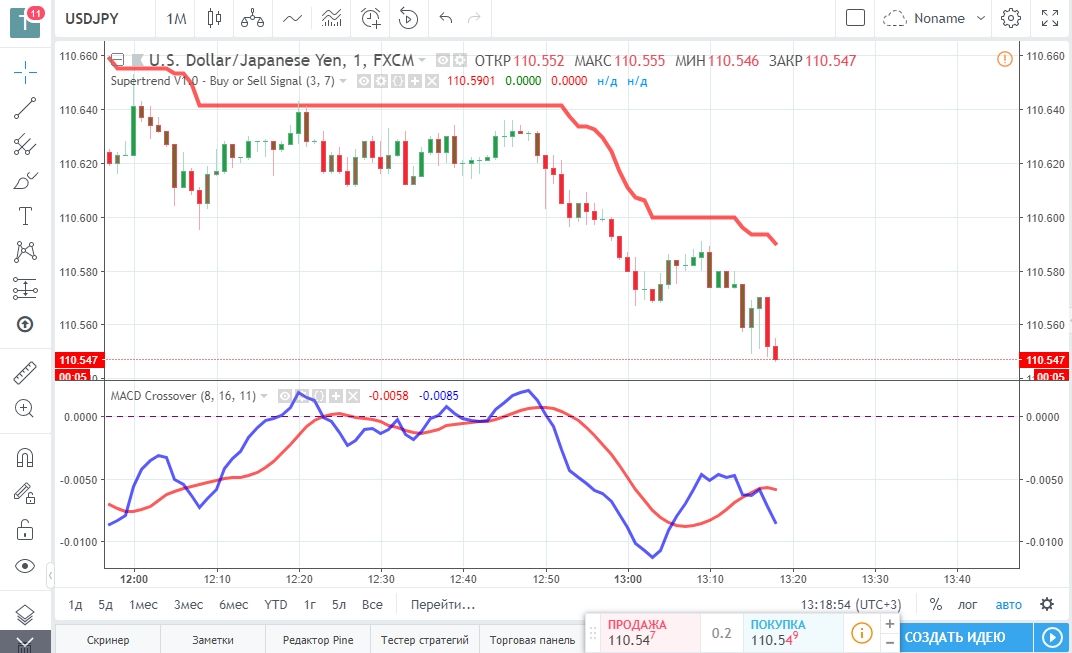
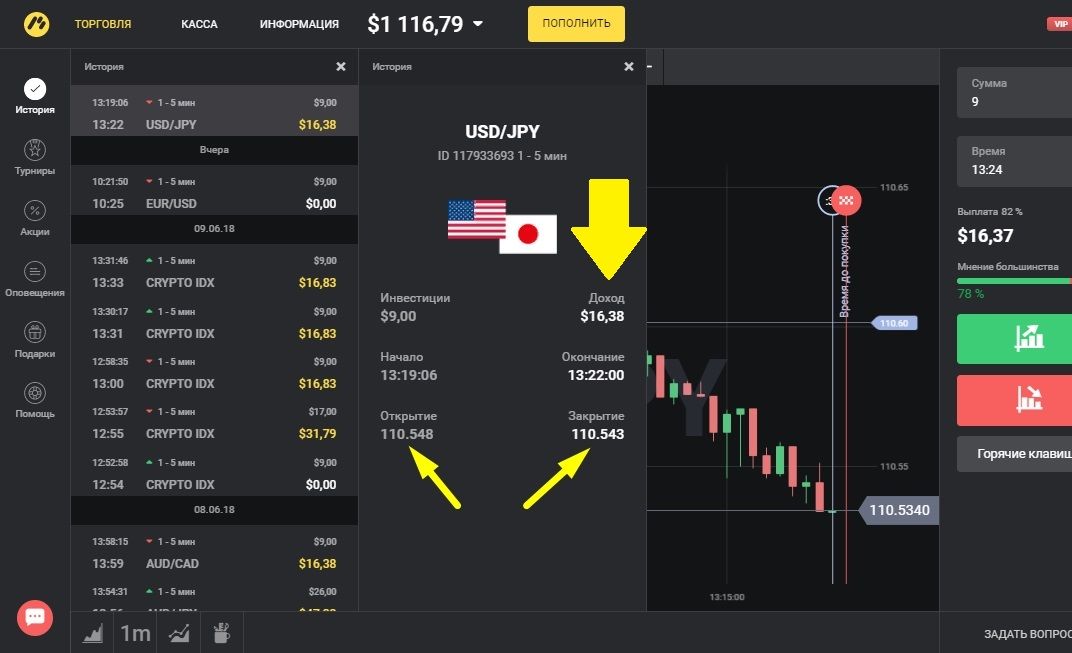
In conclusion, let’s open an indicative trade on the system considered. So, the currency pair of dollar and Japanese yen demonstrates a pronounced downtrend on the chart.
On the TradingView chart, the MACD Crossover curves have crossed. And the Supertrend line is above the candles and has a red fill color. Therefore, we open a down trade for a period of 3 minutes.
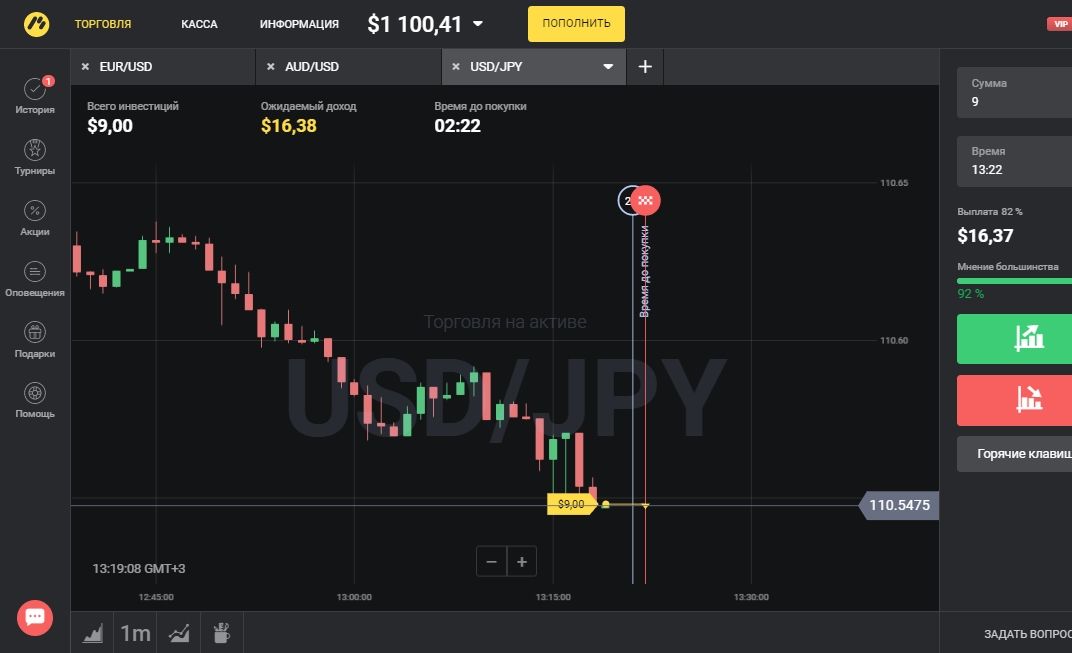
The size of the investment was $9, which for a deposit of $1 100 is less than 1%. For accounts with a balance of $100 or more, the optimal size of an investment in one transaction is 1 USD.
As you can see in the history of transactions – we made a profit. The downtrend on the asset USD/JPY was continued. The chart shows the formation of a narrow price channel with alternating periods of decline and short-term correction.
Reviews