MFI Trading Strategy in the Keltner Channel
Bill Williams is an important personality in the world of trading. He created dozens of different instruments, which are very popular nowadays. One of his indicators is MFI. Its potential is underestimated by most traders, because the instrument is not as popular as, for example, the tool, Alligator.
There are two modifications of the MFI – in the form of a curve moving average (Money Flow Index) and bar graph (Market Facilitation Index). The calculation formula in these cases does not differ, if we do not take into account all possible custom solutions. In this article we will review the “MFI [seiglerj]” indicator. This is one of the modifications presented in the Live Chart of TradingView (go online). Also consider the practical trading strategy for this instrument using the Keltner Channel as a filter.
MFI indicator overview
The tool belongs to the category of volume indicators. The abbreviation MFI (Market Facilitation Index) in Russian means “Market Facilitation Index”. Simply speaking, with its help a picture of what is happening on the market in terms of the total number and volume of exchange transactions during a certain period of time is opened. This index is of key importance in terms of technical analysis.
An increase in the total volume of investments in transactions on the market leads to an increase in volatility. Moreover, the direction of the trend depends on the current balance of power of the two opposing sides – “bulls” and “bears”. This is how the world of trading refers to influential participants in the currency and stock markets, who consciously contribute to an increase or decrease in the value of a particular asset by their actions.
When the balance is relatively even (50/50) – the market is in a calm state. Fluctuations of quotations are minimal. Price formations on the chart begin to build in the horizontal plane. This phenomenon is called flat by traders. Increased influence of the “bulls” leads to the beginning of an uptrend, while the “bears” begin a downtrend. Complete interception of the initiative by one of the parties leads to an unstable state of the market, namely:
- overbought – the finale of an uptrend, when the “bulls” begin to weaken and the price prepares for a reversal;
- oversold – the opposite situation, when the position of the “bears” begins to weaken and the market prepares for the beginning of the upward movement.
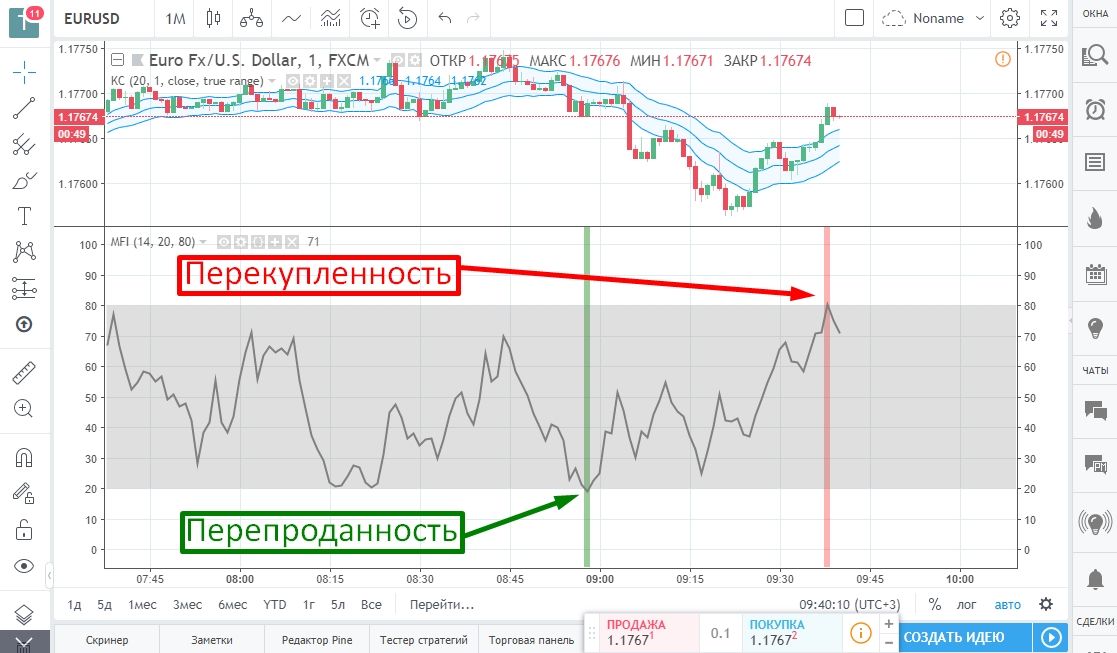
The Money Flow Index is an indicator that looks similar to the RSI. Its modification, presented on TradingView, differs in the presence of overbought and oversold areas highlighting. This allows traders not to miss the signal. The rules are simple:
- down trading – exit of the MFI curve from overbought, below the 80 level;
- upside trade – MFI line out of oversold, above the 20 level.
Bill Williams gives a detailed overview of the MFI in his legendary book – “Trading Chaos”. In it he considered his own theory of the structure of financial markets, as well as presented a number of indicators.
Overview of the Keltner Channel
It is a relatively simple indicator, which shows a channel with the average price value. There is a certain similarity of the tool with Bollinger BandsThe same principle underlies them. However, using different formulas for calculating moving averages ensures that there is no direct correlation between the two indicators.
The Keltner Channel consists of three lines – two extreme lines limiting the price channel, and a middle line. The general rules of technical analysis and existing regularities are applicable to this indicator. In particular, it is a reflection from support and resistance levels.
Trading by strategy
The system is suitable for 1 and 5 minute charts on any asset. You need to open two tabs – in one TradingView for technical analysis, in the other – for PocketOption terminal for trading. You may also like the following reliable Binary Options Brokers: INTRADE.BAR, Binarium, Stars Binary. At Live Schedule two indicators should be added – “Keltner Channel” and MFI [seiglerj]”. For convenience, you can copy the names of the instruments and paste them into the search line without the quotes.
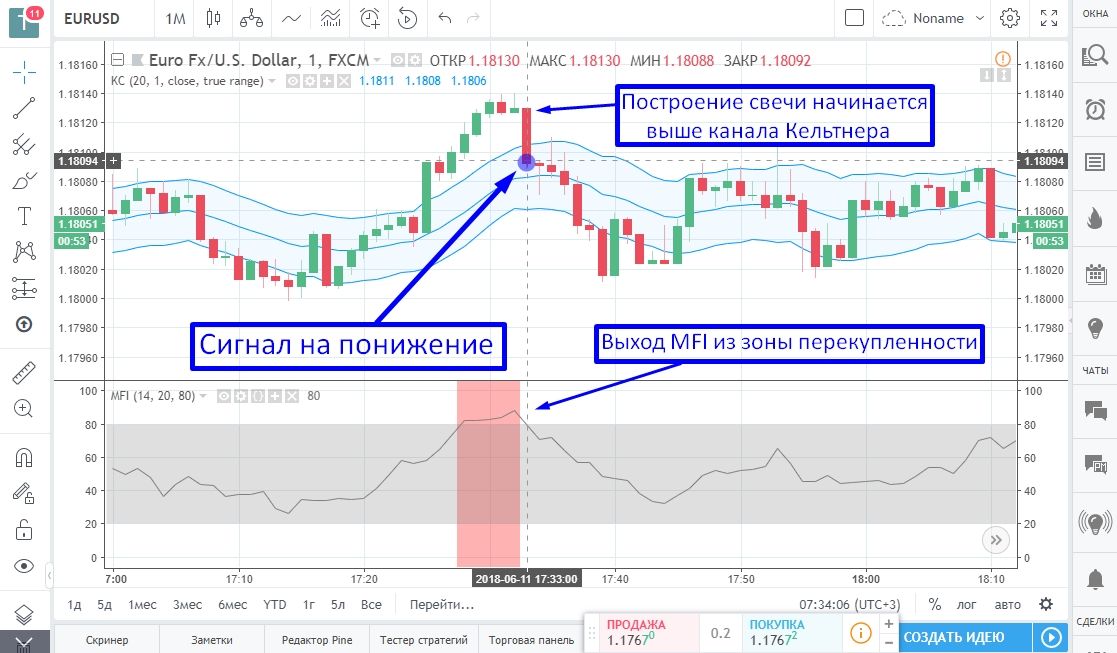
DOWN signal. First, the exit of the MFI curve from the overbought condition, this period in the chart window is marked in red. Secondly, the descending candle should start above the upper boundary of the Keltner Channel.
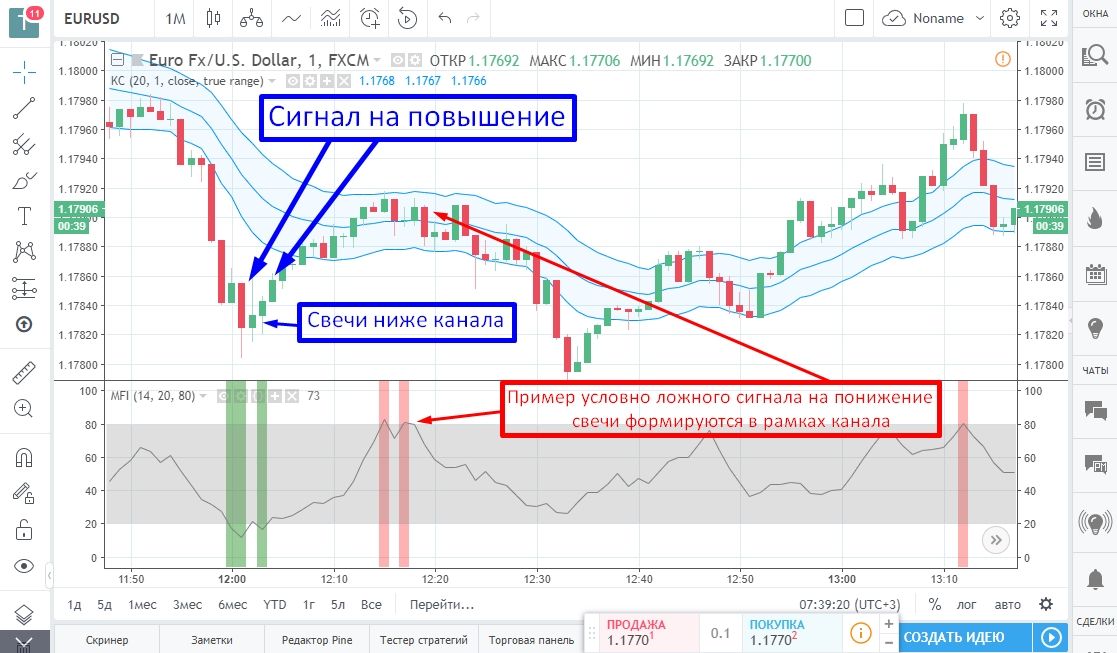
Signal “UP”. First, the return of the index curve from oversold conditions. It is marked in green on the chart. Second, the ascending candlesticks should form below the border of the price channel.
The example above also shows a false down signal. The point is that as long as the price is within the channel, it indicates a low level of volatility. In this particular example under the condition 5 minute expirations profit could be obtained. However, in practice it is recommended to ignore such signals, because in most cases they turn out to be false.
Conclusion
The recommended expiry dates for the strategy are from 1 minute up to 3 minutes. If volatility is low, the duration should be increased. On sharp price jumps, it is optimal to earn on 1-minute deals.
Reviews
What kind of trashy article is this? How can you say that money flow index and market facilitation index are the same thing???? Are you copy-pasting articles based on the similarity of acronyms??? Edit it immediately and don’t mislead newcomers!