Fisher Transform” Trading Strategy
The strategy “Fisher Transform” is based on the use of two indicators – MavilimW and IFT on STOCHASTIC. Stochastic is a classic tool for technical analysis. It is presented in an assortment of PocketOption broker. However, we will use one of its modifications available at TradingView (go online). Improved versions from enthusiastic traders are characterized by preserving all the power of the classic indicators, subject to the presence of auxiliary functionality. Option strategywhich will be discussed in this article, is suitable for short-term trading on the minimum interval.
MavilimW and Inverse Fisher Transform indicator reviews on STOCHASTIC
MavilimW – technical analysis indicator, consisting of one curve moving average. Its fundamental difference from other tools based on Moving Average is the availability of a formula for calculating the combinations of Fibonacci numbers. It is not a standard smoothing of a certain number of bars, but a preliminary rounding of the price to the nearest levels according to the numerical Fibonacci table. The pattern discovered by the Italian mathematician can be seen in many areas, including trading.
Outwardly, the tool looks like a smoothed moving average. It is formed in a wave-like manner. Abrupt changes in the value do not affect the position of the line. The signal is the moment of crossing the curve with the price formations on the chart. In the “Fisher Transform” strategy, this tool is the main one. Entry into the market is made after the appearance of an appropriate signal. However, it must necessarily be confirmed by the second indicator, which usually triggers earlier.
Inverse Fisher Transform on STOCHASTIC – Another custom solution from the same author who created MavilimW. The developer is a Californian trader from the United States with more than 35 years of trading experience. He is an engineer by education, so he is guided in trading by a purely technical approach, completely ignoring the fundamental factors. According to the fundamental theory of tehanalysis, a price chart contains all the information necessary to accurately predict the market behavior in the future. However, analysts must be able to interpret it correctly.
Without going into the technical details of the indicator formula, let’s go straight to its practical advantages. This type of Stochastic is distinguished by its unambiguity. The indicator consists of a single curve, moving in a separate area with the boundaries of overbought and oversold. In contrast to the classical version of the stochastic oscillator Inverse Fisher Transform on STOCHASTIC almost all the time is in one of the areas, crossing the neutral middle part very quickly. It is more sensitive and therefore allows to recognize the points of trend changes in the market. The signals are standard – entry and exit from overbought and oversold areas.
Trading signals for the strategy
The advantage of the strategy “Fisher Transform” is simplicity and unambiguity in the question of interpretation trading signals. Both indicators were developed by the same author, who emphasized minimalism.
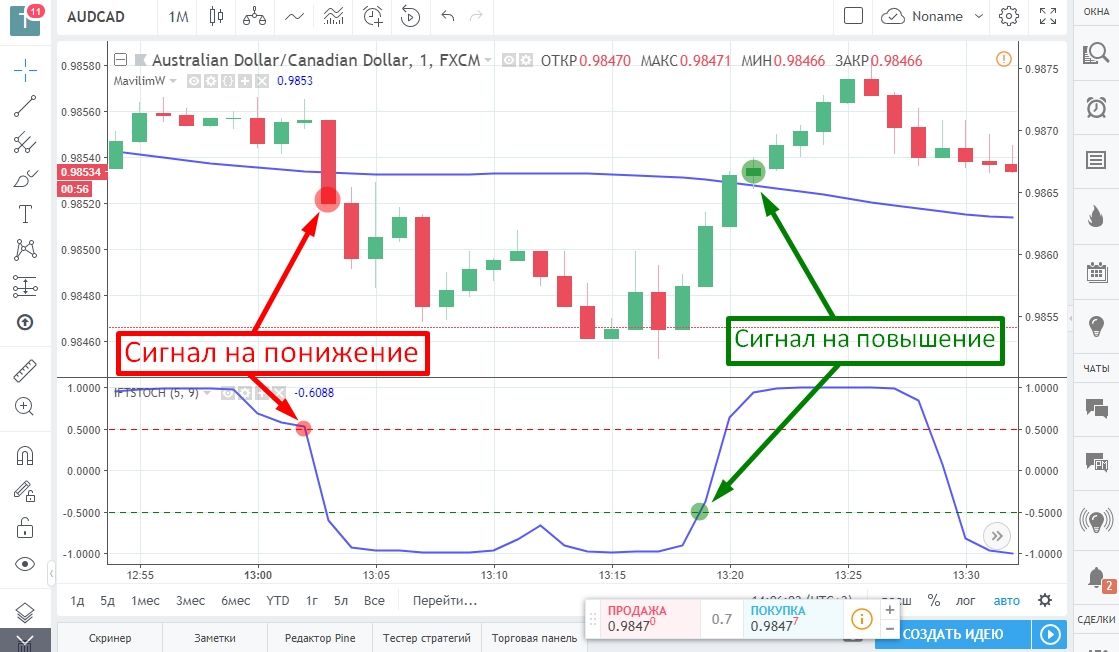
- Trading on the rise – The rising green candle breaks the MavilimW curve from below, the IFT STOCHASTIC exits the oversold zone, breaking the -0.5000 level.
- Down trading – The red falling candle breaks the MavilimW line from above, and the Stochastic returns from overbought conditions, crossing the 0.5000 level from above.
The two indicators discussed above work well together, complementing each other. It is possible to increase the accuracy of signals by paying attention to less important nuances. First, the general rules are applicable to this strategy, stating that when the volatility decreases, the accuracy of signals decreases as well. Therefore, a good signal is the one on the eve of which the maximum deviation of price from the MavilimW curve was recorded. When the price has been moving almost parallel to the line for a long time, it indicates too low market activity. In such a situation it is recommended to refrain from trading or switch to another market. underlying asset.
The second important point is the shape of the line on Inverse Fisher Transform on STOCHASTIC. Ideally it should be in the form of a regular wave with alternating periods of growth and decline. In each cycle, the curve should fully reach the overbought or oversold area. If there is a half-turn or the line takes a zig-zag shape, all this is also a negative factor in terms of passing signals. This is how a horizontal trend manifests itself.
Trading Rules:
- the size of the investment: 1-5% from the deposit;
- expiration and the timeframe of the chart: 1 minute or 5 minutes;
- asset: any currency pairs.
Example of “Fisher Transform” trading strategy
Consideration of visual examples of trading according to the strategies is useful because it allows you to get acquainted with the trading rules closer to practice. On our website, in some reviews, we additionally conduct demonstration trades on the systems in question.
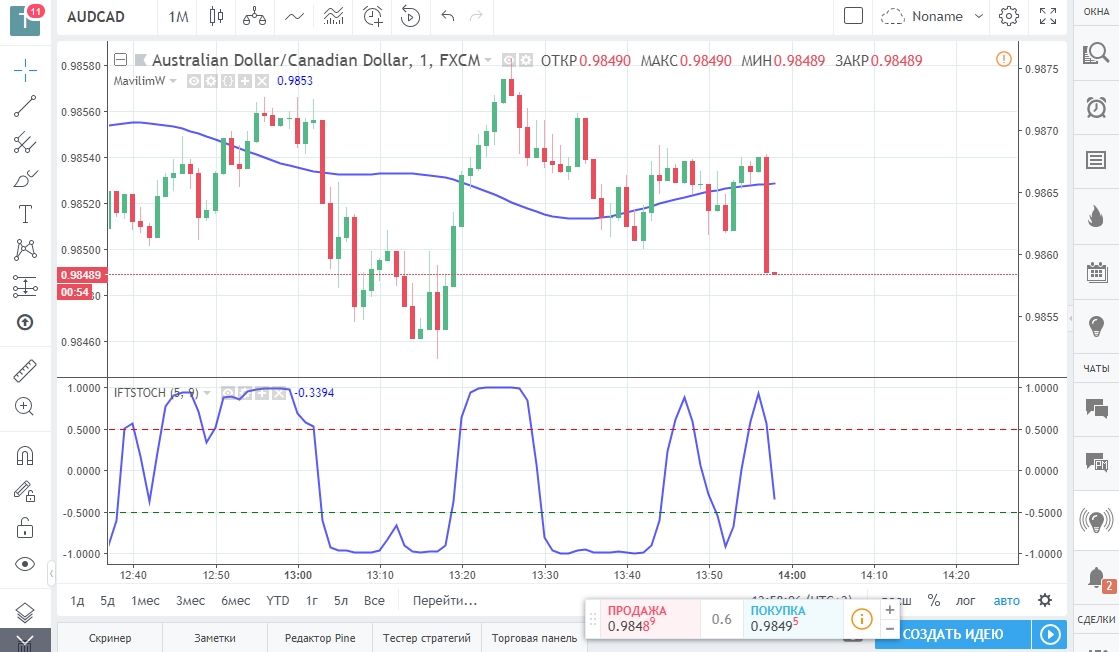
On the TradingView chart, an intense jump in price broke through the moving average. There was also a confirmation from the second indicator.
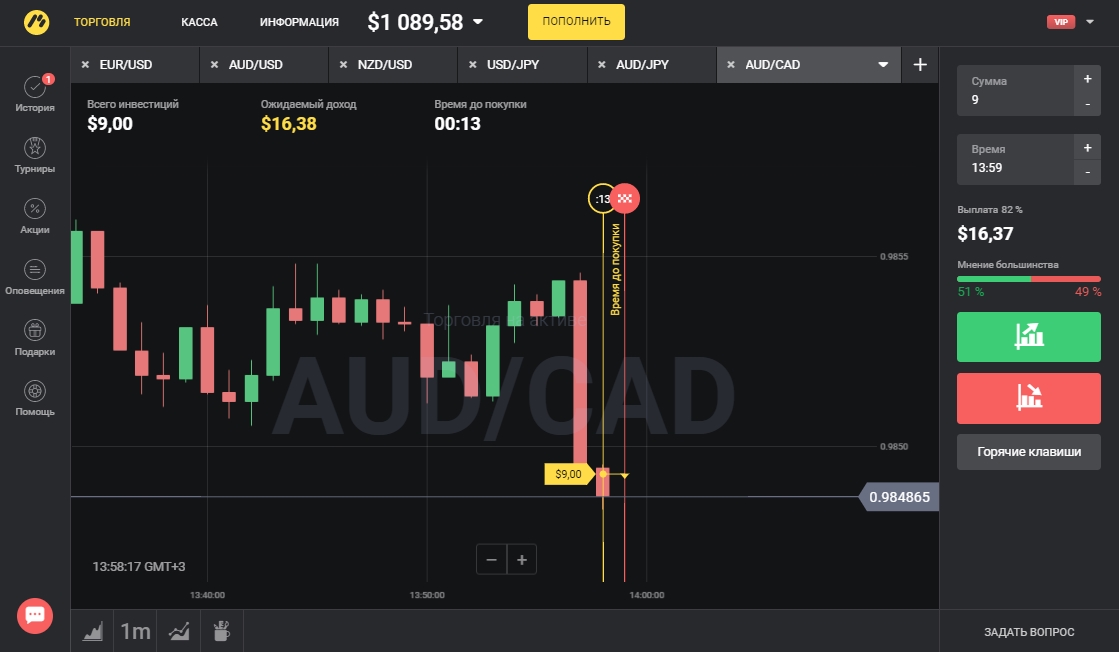
Go to the Pocket Option terminal (go online) and open a trade. Entry into the market is made immediately after the signal candle closes.
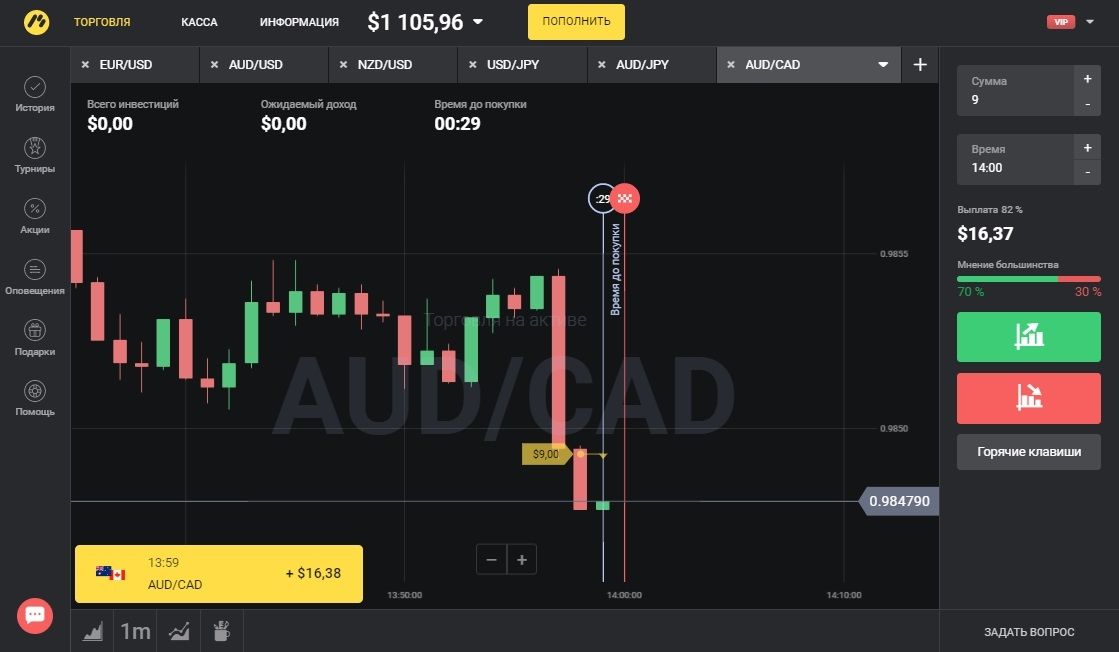
Passes 1 minute – the transaction was closed with 82% profit. The trading system signal worked all 100%. The minimum duration of the transaction allowed us to make a profit on such a sharp price fluctuation, and it is followed in most cases by a correction, which can prevent the transaction from closing in the plus.
Reviews